

Deactivating plugins one by one can find a conflict, but it is a poor first diagnostic on a production site. It changes behavior, breaks dependencies, and does not explain why a request is slow.
A better investigation starts with one reproducible request and follows the database queries, hooks, remote calls, filesystem work, memory use, and plugin attribution inside it.
Define the request
Record the URL, user state, request method, cache state, time, and expected result. An admin search, checkout request, REST call, and cron job take different paths. Reproduce the issue several times so cache warming or temporary API latency does not become the diagnosis.
Separate server and browser time
Browser tools show network and asset timing, but not PHP execution by themselves. Server-side evidence should separate database time, PHP work, remote HTTP calls, and peak memory. Record remote endpoints, timeouts, and whether calls block the response.
Attribute work to components
Plugin attribution connects a query, hook, or stack trace to the code that introduced it. That is more useful than total query count. WPStack TOP Load Monitor captures request snapshots, slow queries, anomalies, and plugin-cost attribution.
- Capture component timing
- Record slow queries and call sites
- Inspect remote requests
- Compare peak memory
- Look for repeated work in loops and hooks
Run controlled experiments
Once evidence points to a feature, test the same request on staging. Disable the smallest relevant feature first. Keep cache, dataset, user state, and server conditions comparable. The goal is to decide whether configuration, a query, an integration, or the entire component needs to change.
Choose a targeted fix
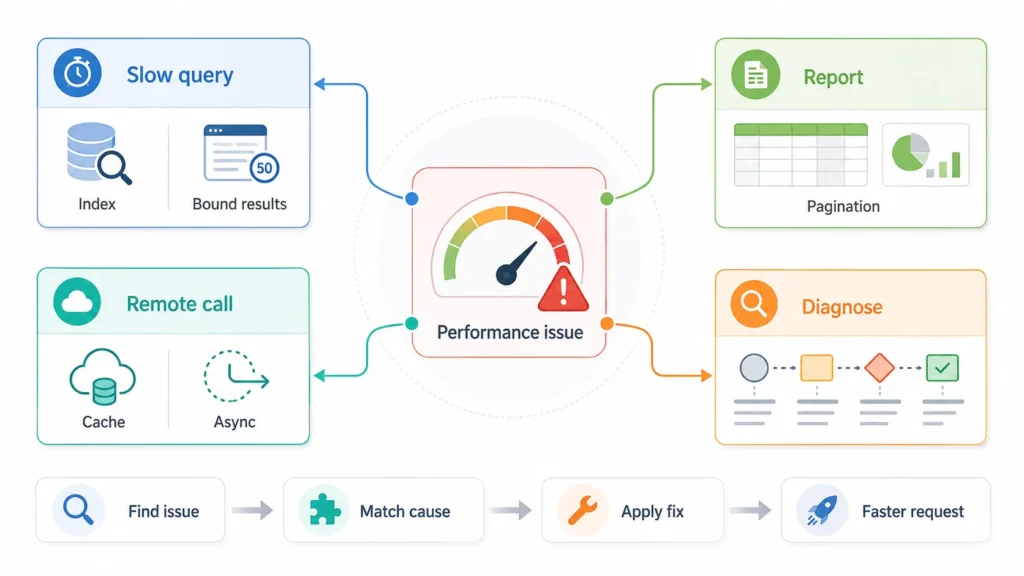
A slow query may need an index or bounded results. A remote call may need caching or asynchronous execution. A report may need pagination. Our guide to diagnosing slow requests provides the wider workflow.
Create a request comparison matrix
Capture the same request under anonymous, logged-in, cached, and uncached conditions when relevant. Compare a normal sample with a slow sample and note which component timing changed. This helps separate a globally expensive plugin from a feature that is costly only on a report, checkout, search, or synchronization request.
Watch for common blind spots
Slow work can happen after the browser receives a response. WP-Cron jobs, Action Scheduler queues, webhook consumers, image processing, email delivery, and imports may not appear in a frontend waterfall. Conversely, a fast PHP response can still produce a slow page because of large scripts, fonts, images, or third-party browser code. Use the tool that observes the layer where the delay occurs.
Turn evidence into an acceptance test
Write the expected behavior and a measurable threshold before remediation. For example, limit a report to paginated results, move an API call out of the request, or ensure a repeated lookup uses a supported cache. Re-run the same dataset and conditions after the change. This makes performance work reviewable and prevents a vague “feels faster” conclusion.
Find the Plugin Causing Your WordPress Performance Issues
Slow WordPress requests need evidence, not guesswork. Contact WPStack for a detailed WordPress performance diagnosis to trace slow database queries, hooks, remote API calls, memory usage, scheduled jobs, and plugin-level costs. Our team helps you identify the exact bottleneck and apply a targeted fix without unnecessarily disabling essential plugins.
Frequently asked questions
Not by itself. Cost depends on what each plugin executes for a given request.
It provides valuable evidence, but some issues require application profiling, server metrics, or load testing.
Test cached and uncached requests. Uncached work affects cache misses, admin, logged-in users, checkout, REST, and cron.
Compare the same request, dataset, user, cache state, and server conditions. Use repeated samples rather than one result.

Aditya Bhimrajka is a technology entrepreneur, product strategist, and software solutions expert with over a decade of experience building scalable web and mobile applications. His expertise spans SaaS, AI, cloud technologies, custom software development, and digital transformation. Passionate about solving real-world business challenges through technology, Aditya shares practical insights on WordPress, plugins, software development, startup growth, product strategy, and emerging technologies. At WPStack, he writes actionable, experience-driven content that helps developers, businesses, and website owners build secure, high-performing, and future-ready WordPress solutions.