
WPStack TOP Load Monitor
Developer-grade WordPress performance monitoring with live request snapshots, slow-query detection, anomaly alerts, plugin-cost attribution, and optional AI assistance.
Email me important plugin updates
Optional. Get security notices and meaningful release updates for WPStack TOP Load Monitor. The download does not require an email or account.
About the plugin
WPStack TOP Load Monitor gives WordPress developers and site administrators a clear, real-time view of what each request is doing. It records performance snapshots, identifies slow and duplicate queries, captures PHP errors, visualizes request timelines, and turns raw diagnostics into practical recommendations.
The plugin works without Composer, a build step, or an external monitoring service. Its native insights run entirely in WordPress. Optional NVIDIA or OpenRouter integration can add richer summaries and a contextual AI chat assistant, but no external calls are made until an administrator explicitly configures a provider.
What it helps you do
Core monitoring
- Captures request load, memory delta, query count, slow queries, duplicate queries, request context, and PHP errors at shutdown.
- Stores snapshots in a dedicated database table with safe, repeatable activation migrations.
- Intercepts slow SQL with execution time and caller-stack information.
- Uses configurable sampling so production teams can balance visibility and overhead.
Live visibility
- Shows a live admin-bar indicator for load time, query count, and memory without a database hit.
- Provides a real-time dashboard with metric cards, performance charts, recent requests, alerts, slow queries, errors, process breakdowns, and smart insights.
- Includes dedicated snapshot detail pages with AI summaries, timeline waterfalls, query breakdowns, error streams, and plugin attribution.
- Offers one-minute, five-minute, and fifteen-minute statistics with averages, peaks, and p95 measurements.
Native smart insights
- Builds a rolling baseline from recent snapshots and flags statistically unusual performance using z-score analysis.
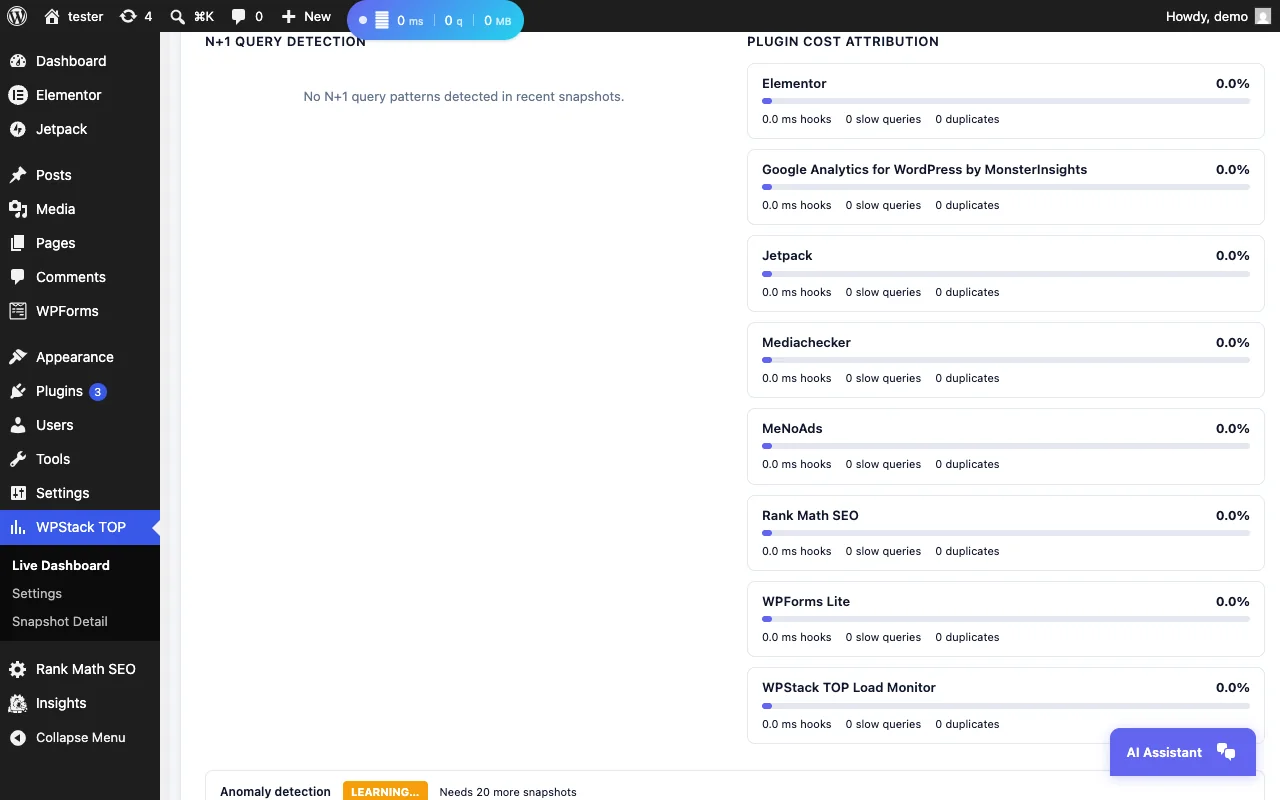
- Detects N+1 query patterns fired repeatedly from the same caller.
- Generates focused recommendations for postmeta, options, terms, users, posts, and WooCommerce-related patterns.
- Ranks plugins by performance cost using hook time, slow-query time, and duplicate-query signals.
- Creates plain-language health summaries with good, warning, and critical classifications.
Optional AI assistance
- Supports NVIDIA and OpenRouter through an OpenAI-compatible API format.
- Adds enhanced root-cause summaries and actionable optimization suggestions.
- Includes a contextual chat assistant for questions such as why a page is slow or which plugin is heaviest.
- Sends no data externally unless an administrator enables and configures a provider.
Alerting, reliability, and developer tooling
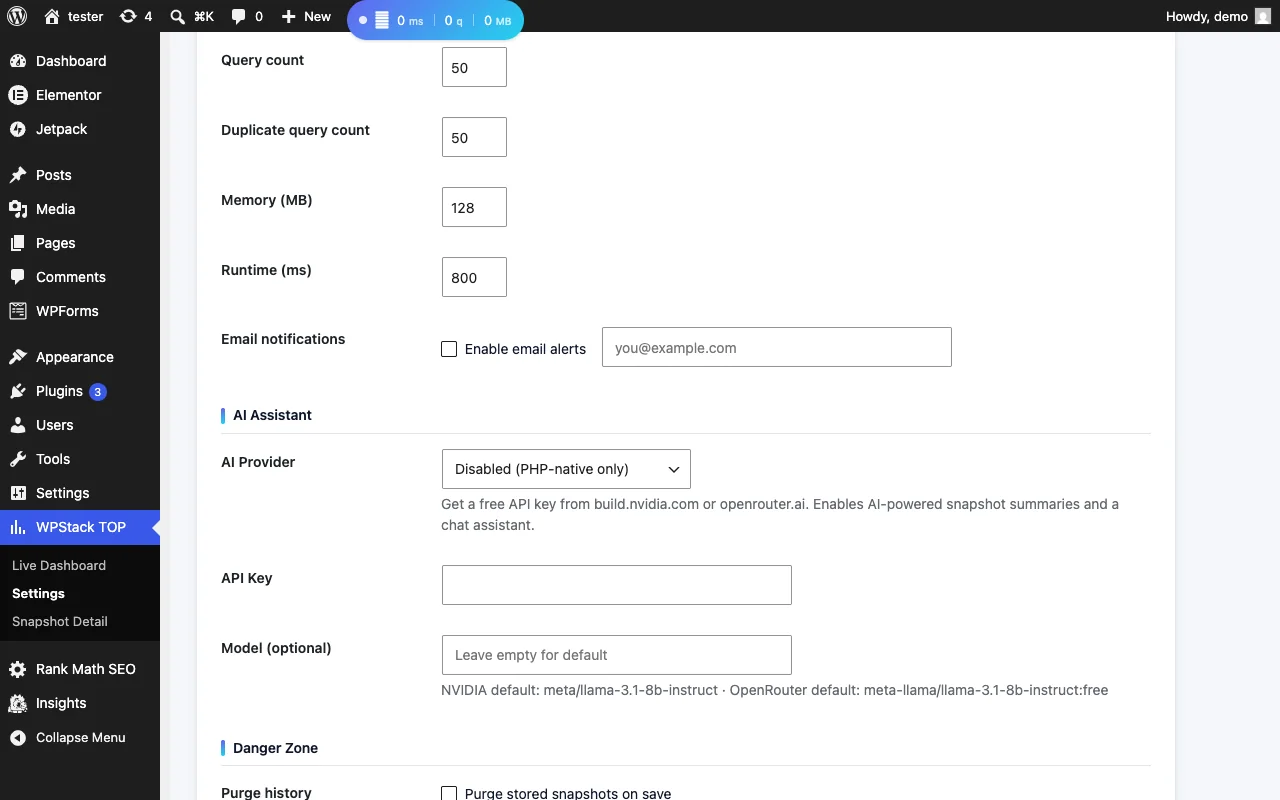
- Provides configurable thresholds for load, slow queries, query count, duplicates, memory, and runtime.
- Deduplicates alerts with a five-minute cooldown.
- Uses a bounded in-memory ring buffer for fast polling and cached settings with a transient fallback.
- Includes a local Chart.js fallback when the CDN is unavailable.
- Protects REST and AJAX operations with administrator capabilities and nonce verification.
- Includes a REST API under
wpstack-top/v1for dashboard data, snapshots, timelines, insights, chat, and settings. - Ships with internationalized interface strings and an integration test harness containing more than 70 assertions.
Plugin screenshots
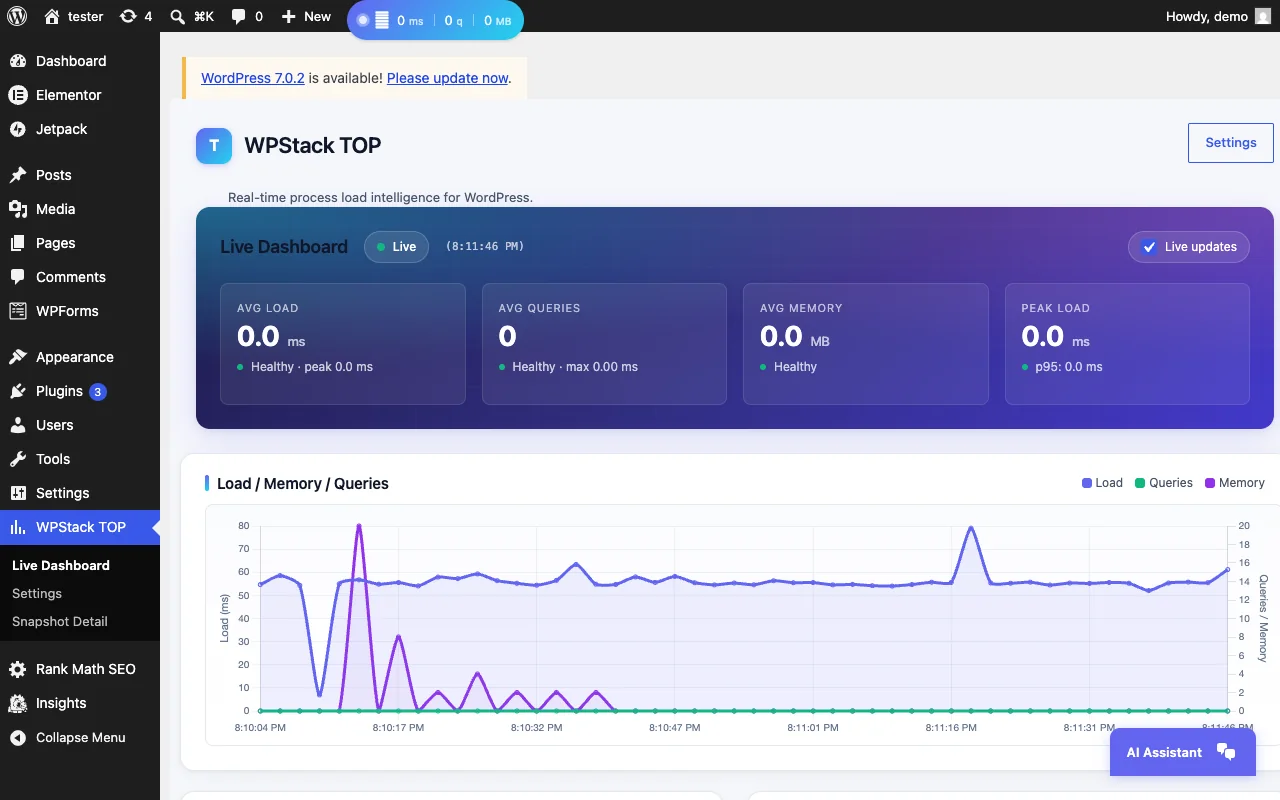

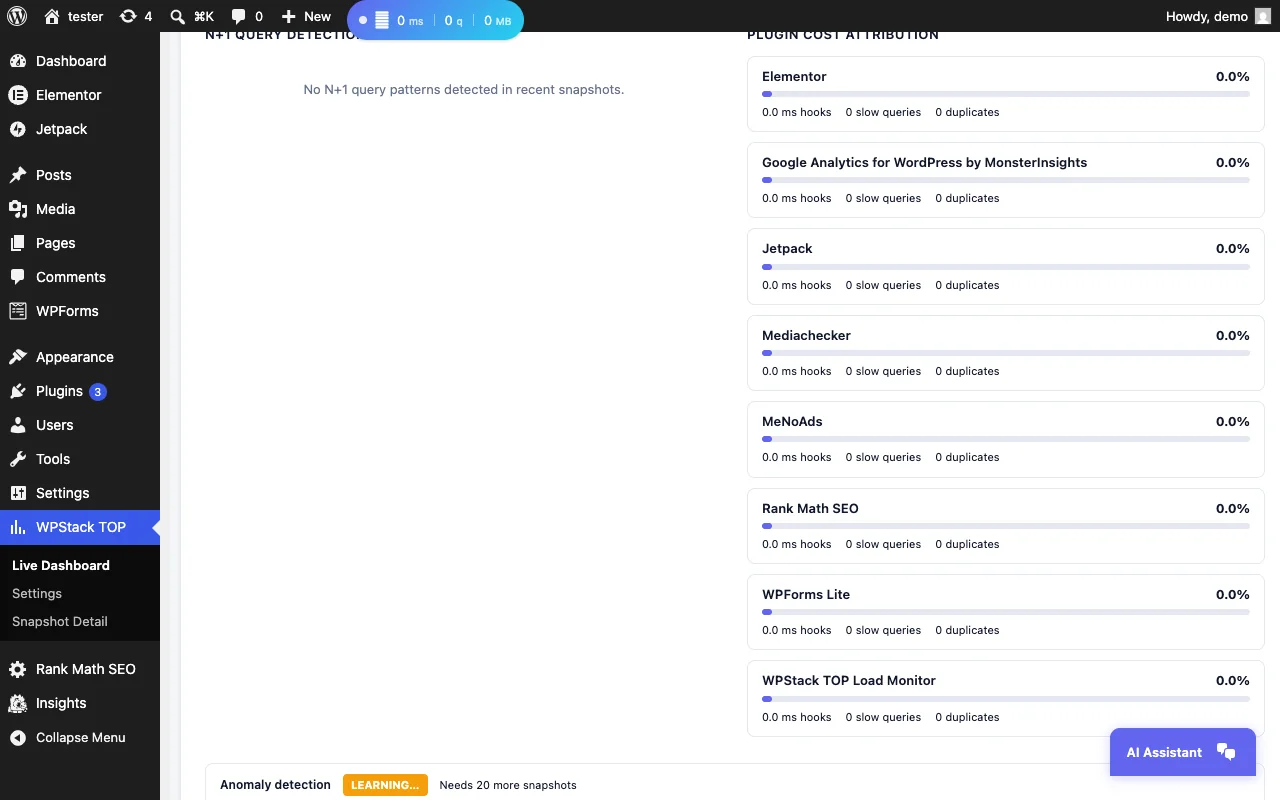
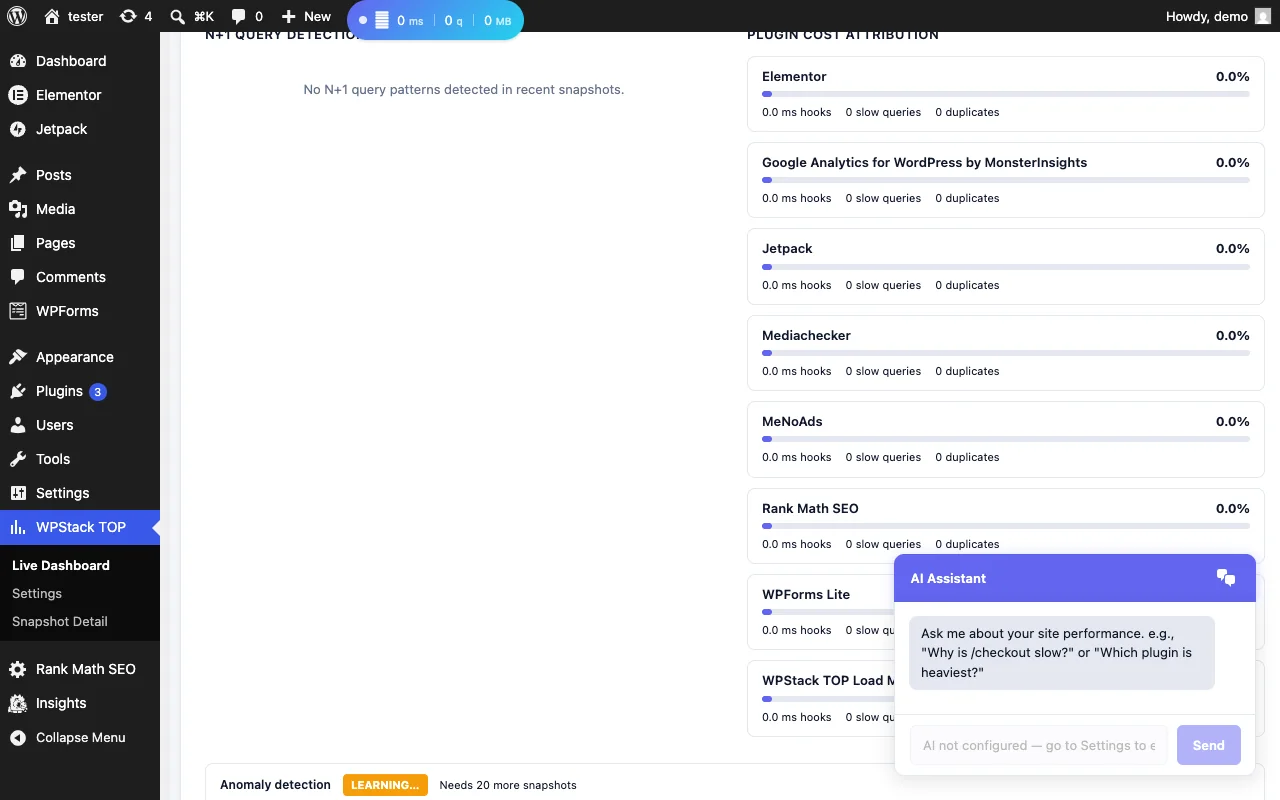
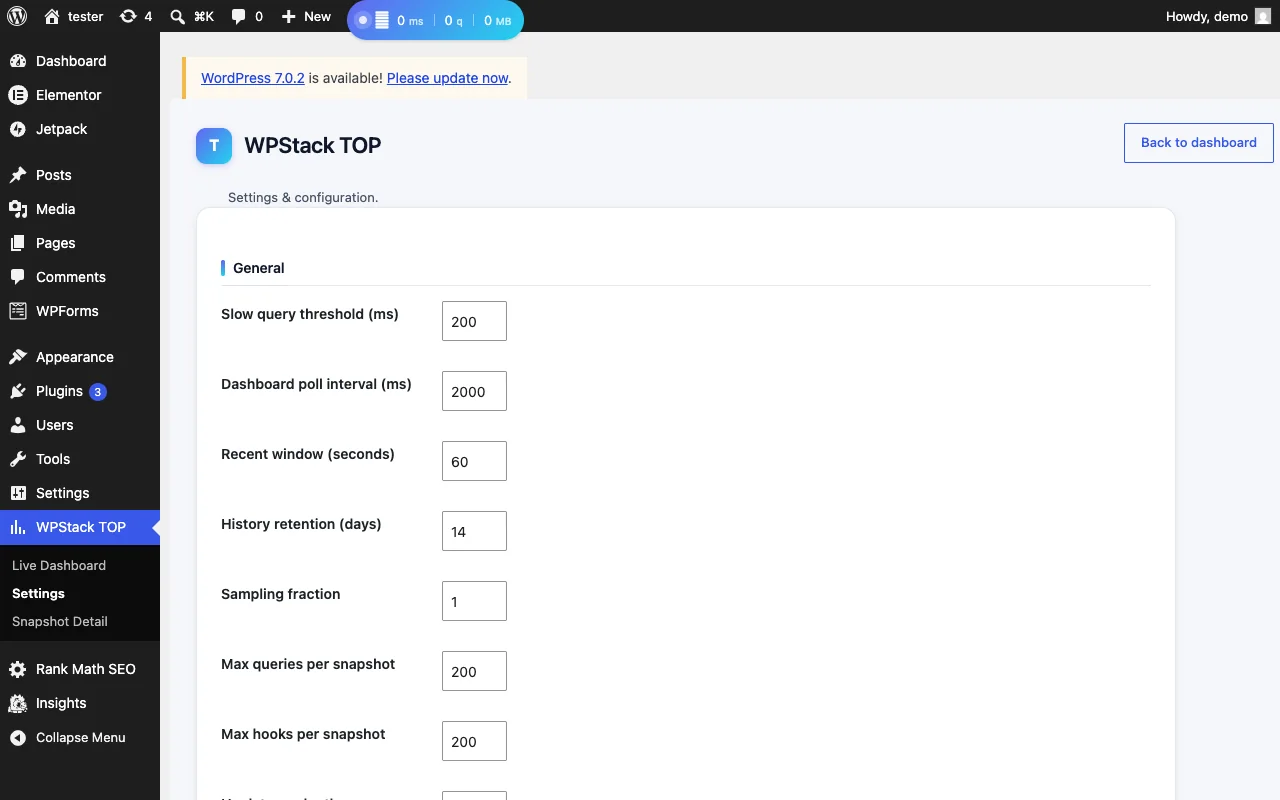
Installation
- Download the WPStack TOP Load Monitor ZIP file.
- Open WordPress and go to Plugins > Add New Plugin > Upload Plugin.
- Select wpstack-top-load-monitor-1.1.0.zip, then install and activate it.
- Open the WPStack TOP dashboard in wp-admin to review live request data.
- Adjust sampling, retention, alert thresholds, and tracking modules in Settings.
- Optional: configure NVIDIA or OpenRouter only if you want enhanced summaries and the AI chat assistant.
Changelog
1.1.0
- Added rolling-baseline anomaly detection with z-score analysis.
- Added automatic N+1 query detection and table-specific recommendations.
- Added plugin performance-cost attribution.
- Added native plain-language snapshot summaries and health classification.
- Added optional NVIDIA and OpenRouter integrations.
- Added the Smart Insights dashboard panel, snapshot AI summaries, and contextual AI chat.
- Added REST endpoints for insights and chat.
- Improved SQL aggregation, snapshot lookup, ring-buffer polling, expiration throttling, and hook-trace configuration.
- Expanded security, internationalization, local Chart.js fallback, documentation, and integration testing.
1.0.0
- Initial release with dashboard, timeline, slow-query log, history, alerts, and settings.
- Added the live admin-bar indicator, REST API, AJAX fallback, custom snapshot table, query interception, PHP error capture, configurable sampling, retention, tracking modules, and threshold-based email alerts.
Support and usage notes
Related reading: How to diagnose slow WordPress requests and database queries and the post-release maintenance checklist.
WPStack TOP Load Monitor FAQs
What does WPStack TOP Load Monitor measure?
It records request load, memory delta, query counts, slow and duplicate queries, request context, PHP errors, and related performance evidence.
Will monitoring add overhead to WordPress?
All monitoring has some cost. The plugin provides configurable sampling so teams can balance diagnostic visibility against production overhead.
Can it help identify expensive plugins or database queries?
Yes. It captures slow-query and caller information and provides plugin-cost attribution, request snapshots, and diagnostic breakdowns.
Is it a replacement for server-level application monitoring?
No. It provides WordPress-specific request evidence and should complement hosting, PHP, database, and infrastructure monitoring when those systems are available.