
How to Measure WordPress Plugin Demo Quality Without Invasive Tracking
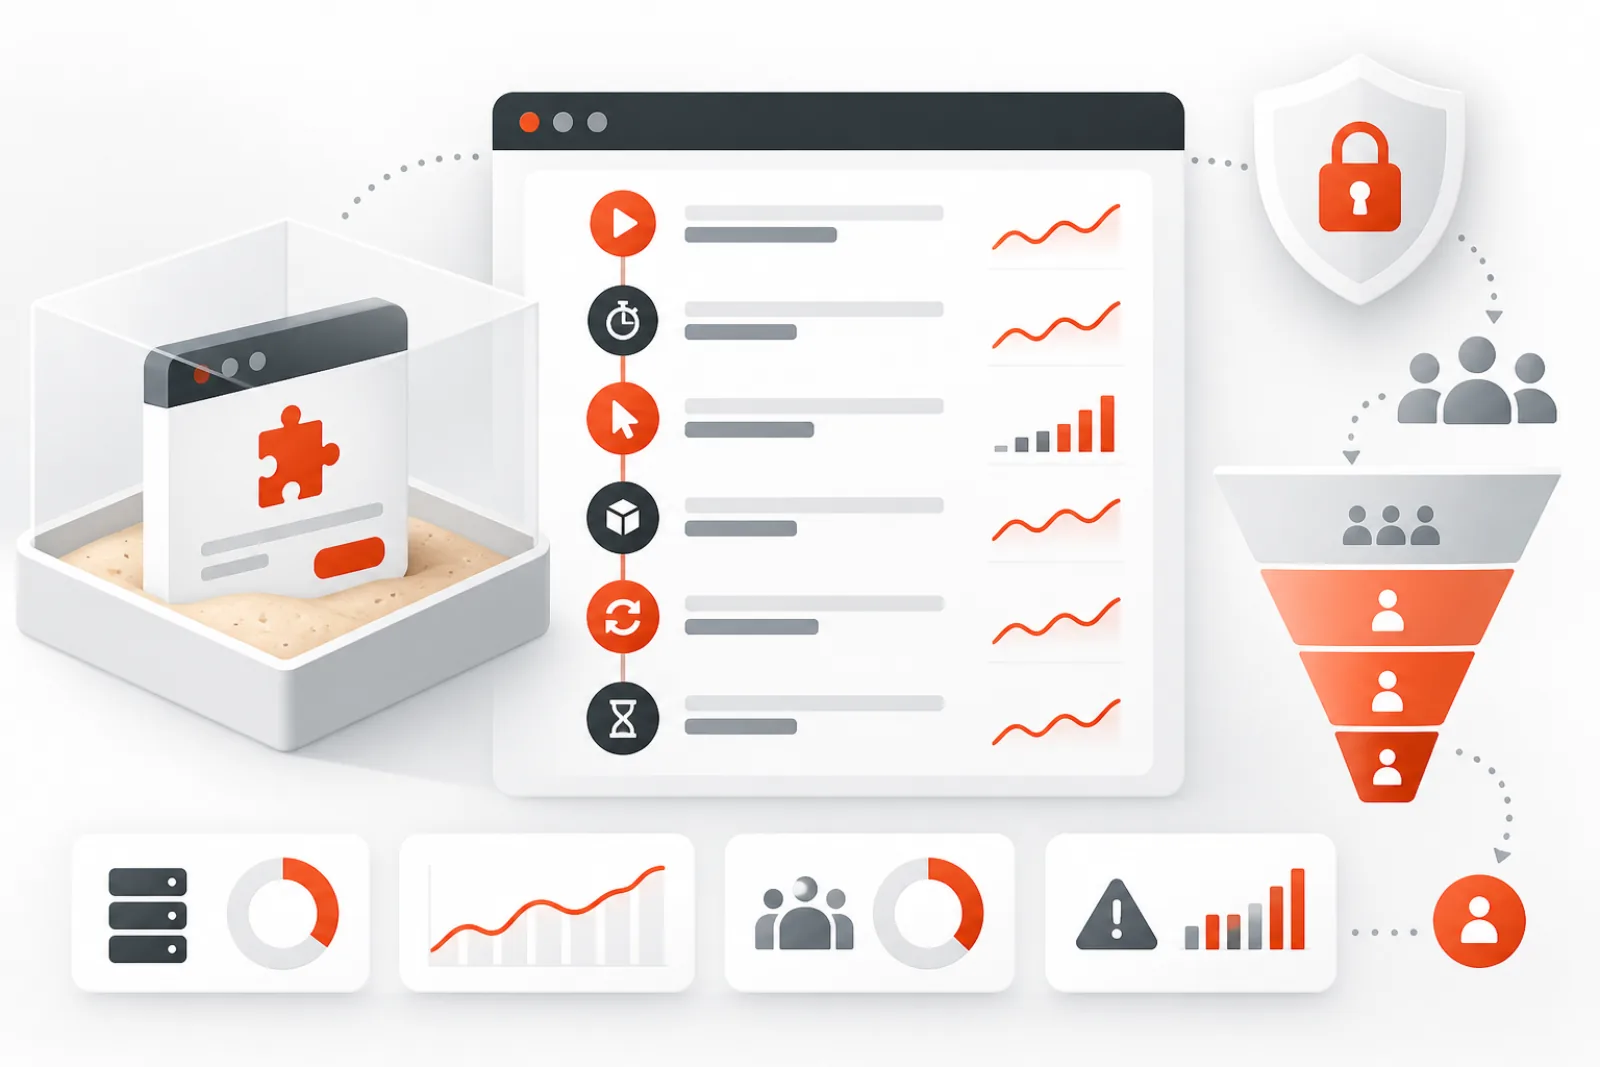
A plugin demo is useful only if visitors can launch it, reach the value quickly and complete a realistic task safely. Page views alone cannot tell you that. At the other extreme, recording everything inside a temporary admin account creates unnecessary privacy and security risk.
A better measurement plan uses a small set of aggregate lifecycle and feature events, excludes sensitive field contents, and connects each metric to a product or platform decision.
Define the demo question
Write one primary question per product: can the visitor configure the feature, understand its result and decide whether it fits? Then identify the minimum journey: launch, automatic login, first meaningful interaction, primary outcome, reset or expiry, and optional handoff to documentation or pricing.
Measure the platform separately from the product
| Layer | Useful metrics | Decision |
|---|---|---|
| Launch | Success rate, queue time, capacity rejection | Infrastructure and limits |
| Session | Time to login, duration, extension and reset rate | Timing and onboarding |
| Product | First key action, completion, error category | Seed data and UX |
| Handoff | Documentation, pricing or contact action | Commercial clarity |
A failed launch is not evidence that the plugin is confusing. A launch that succeeds but never reaches the first key action may indicate unclear guidance, weak sample data or a session that is too short.
Design privacy-safe events
Use allowlisted event names and coarse attributes: product identifier, session state, elapsed-time bucket, result category and anonymous experiment variant. Do not collect form contents, post text, uploaded media, passwords, IP addresses in product analytics, request bodies or arbitrary URLs containing tokens.
If abuse prevention requires a visitor identifier, keep it separate from product analytics, minimize retention and document the purpose. Aggregate reports should not make individual sandbox activity replayable.
Create an event dictionary
demo_launch_requestedand success/failure category;automatic_login_completedwith elapsed-time bucket;first_key_actiondefined separately for each plugin;primary_outcome_completed;session_extended,resetandexpired;capacity_rejectedand cleanup retry category;- documentation or commercial handoff, without capturing destination query strings.
Every event needs an owner, trigger definition, allowed properties, retention period and test. If nobody can name the decision a metric changes, do not collect it.
Turn metrics into fixes
- Investigate launch failures before changing product onboarding.
- Compare median time to first key action by product and device class.
- Review anonymized error categories and reproduce them in a test sandbox.
- Inspect whether resets indicate useful experimentation or confusing dead ends.
- Change one seed, instruction or timing rule.
- Run a defined observation window and compare.
Instrument lifecycle boundaries reliably
Emit launch success only after the site, temporary user, required plugins, seed and automatic login are ready—not when creation merely begins. Emit cleanup success only after both temporary site and user are gone. Failed and retried operations need stable job identifiers so retries do not inflate counts.
Use server-side timestamps for infrastructure stages and browser timing for interactive milestones. Keep the two clocks distinct. A slow automatic login may come from server provisioning, redirect chains or client network delay; one blended duration cannot identify the owner.
Set service objectives
Define targets for launch success, p95 time to usable sandbox, cleanup completion and maximum capacity rejection. Alert on sustained breaches, not isolated noise. Segment by product because a heavy ecommerce seed may legitimately provision more slowly than a small settings plugin.
Publish an internal weekly scorecard with numerator, denominator and exclusion rules. If staff or automated QA sessions are excluded, identify them through an explicit test marker rather than fragile IP-address filtering.
Validate the analytics itself
Run a scripted journey that launches, performs the key action, resets and expires. Confirm each event appears once with only allowlisted properties. Test ad blockers and failed network delivery so product behavior never depends on analytics success. Compare aggregate event counts with the server session registry to detect missing or duplicated telemetry.
Review retention and access quarterly. Remove unused properties, rotate credentials and make sure exported reports cannot identify a visitor through rare combinations.
Worked funnel example
Imagine 1,000 launch requests: 970 sandboxes become usable, 820 visitors complete automatic login, 610 reach the first key action, 390 complete the primary outcome and 80 open pricing or contact information. Report every denominator. Saying “39% completed” hides a 3% launch failure; saying “8% converted” hides where the product journey loses people.
Investigate the largest verified drop with qualitative testing. If automatic login is healthy but first action is weak, improve the seed and in-product orientation. If completion is healthy but handoff is weak, clarify fit and next steps rather than changing infrastructure.
Avoid misleading comparisons
Do not compare products with different journey lengths as if completion were identical. Separate first-time and returning visitors only when the privacy model permits it. Annotate releases, outages and capacity changes so a metric shift is not attributed to copy when the underlying platform changed.
Publish an internal decision log
For each experiment, record hypothesis, metric, observation window, result, decision and owner. Include guardrails such as launch reliability, cleanup success and support complaints. This prevents repeated tests and discourages chasing small conversion changes that damage trust or safety.
Avoid optimizing only for longer sessions. A clear plugin may prove its value quickly. Completion and qualified next actions are usually stronger than raw duration.
Write metric definitions that cannot drift quietly
For every metric, record event names, numerator, denominator, eligibility, time window, deduplication key, excluded sessions, owner and decision. “Launch success rate” might mean usable sandboxes divided by accepted requests; it should not exclude failed provisioning after the request merely because no site ID was created.
| Metric | Required definition | Common distortion |
|---|---|---|
| Launch success | Usable sessions divided by eligible accepted launch requests | Counting creation started as success |
| Time to usable | Request accepted to authenticated interactive page | Stopping at database creation |
| First key action | Product-specific action with validated outcome | Counting any click inside the plugin |
| Primary completion | Named journey outcome divided by usable eligible sessions | Changing denominator between reports |
| Cleanup success | Site, user, files and queued work reconciled as removed | Counting deletion queued as complete |
Version the event dictionary. A changed trigger creates a new metric definition or an annotated break in the series. Historical charts should not imply comparability when instrumentation changed.
Separate reliability, usability and commercial fit
Reliability asks whether the platform created, authenticated, reset and deleted the sandbox. Usability asks whether the visitor found and completed the product task. Commercial fit asks whether the experience led to qualified documentation, pricing or contact behavior. Keep these layers separate so the responsible team receives the right problem.
A visitor who completes the journey and leaves may have learned that the plugin is not a fit; that can still be a successful demo. A pricing click after a broken launch is not proof of product value. Use qualitative feedback or support context to interpret the funnel without recording sensitive session content.
Validate event delivery under failure
Analytics must never block product actions. Queue events with bounded retries, validate against an allowlist and discard malformed payloads safely. Use stable session and event IDs so a retry does not double-count. Test browser blocking, network loss, duplicate delivery, late delivery and out-of-order lifecycle events.
Reconcile daily accepted launches, active sessions and deletions against operational records. Large differences indicate telemetry loss or duplication. Keep operational logs longer only when necessary for reliability; product analytics should use its own minimized retention.
Exclude staff, automation and abuse transparently
Mark QA and employee sessions using an explicit test flag or dedicated launch path. Do not depend on office IP addresses, which change and may overlap legitimate users. Synthetic monitoring should exercise the real lifecycle but carry an allowlisted marker excluded from product conversion reports.
Identify obvious automated abuse through the rate-limiting system and report it as platform traffic, not product abandonment. Preserve the raw denominator and exclusion count in internal reports. An unexplained “cleaned” funnel invites optimistic bias.
Use time distributions, not averages alone
Report median, p75, p95 and failure rate for launch and cleanup times. Averages can hide a small but important group waiting several minutes. Segment by product seed, region, device class and capacity state only when cohorts are large enough and privacy controls allow it.
Choose service objectives from user impact and tested capacity. Alert when breaches persist over a defined window. One slow session may be normal variance; a rising p95 with capacity rejections signals approaching saturation.
Design experiments with guardrails
State hypothesis, primary metric, guardrails, minimum observation window, audience, change owner and rollback before launch. Randomize at a stable privacy-safe session level, and do not change the seed, capacity and onboarding simultaneously. Guardrails should include launch reliability, error rate, cleanup success, support complaints and accessibility.
A small conversion increase does not justify a significant reliability decline. Avoid repeated peeking and stopping when a chart looks favorable. Where traffic is low, use directional evidence plus observed usability sessions instead of pretending statistical certainty.
Add privacy-safe qualitative research
Aggregate events reveal where a journey stops, not why. Conduct moderated tests with consent, or offer an optional short feedback prompt after completion or exit. Ask about the task, missing data, confusing label and decision—not personal background. Keep recordings separate, access-controlled and retained for a stated period.
Review support conversations and demo feedback by theme after redaction. Reproduce reported failures in a fresh sandbox. Combine this evidence with the funnel before changing onboarding; the largest numerical drop may be an intentional branch.
Worked diagnosis: completion falls after a seed update
A media plugin’s primary completion rate falls from 62% to 41% after release. Launch and login metrics remain stable. The event definition is unchanged, but the new seed contains 800 images instead of 80, making the first scan take longer than the session’s guidance suggests.
Browser and server timings confirm the scan completes reliably but users leave before results. The team reduces the default seed to 150 representative files, keeps a separate large-volume scenario, and updates the expected-duration message. Completion returns without hiding product limits. The decision addresses demo design rather than inflating capacity.
Worked diagnosis: a false cleanup success rate
The dashboard reports 100% cleanup because it counts jobs accepted by the deletion queue. A reconciliation later finds temporary users and scheduled actions remaining after several site deletions failed. The metric rewarded initiation, not outcome.
The team changes success to require site absence, user absence and cleared job state, adds retry categories and alerts on age. Historical reports receive a definition break. The lower new percentage is more valuable because it exposes an operational risk that can be fixed.
Build an executive and operator view
The product view should show eligible launches, usable sessions, first action, primary completion and qualified handoff with stable denominators. The operations view should show launch time distributions, failures by stage, capacity rejection, active sessions, cleanup backlog and oldest failed job. Both link to the metric dictionary and release annotations.
Avoid leaderboards that compare unlike plugins. Use each product’s baseline and journey. Add confidence or sample size, highlight known instrumentation gaps and name an owner for every red condition. Reports exist to trigger action, not to decorate a meeting.
Audit collection and retention
Quarterly, list every event and property, the decision it supports, access group, retention, export destinations and deletion method. Remove unused fields. Verify that query strings, free text, filenames, IP addresses and identifiers are not slipping through generic logging or error payloads.
Test data-subject and organizational deletion processes where applicable. Rotate credentials, review vendor terms and confirm analytics outages do not affect the sandbox. The smallest useful dataset is easier to secure, explain and trust.
Understand attribution limits
A public demo may be discovered through search, documentation, a marketplace listing, sales outreach or an existing customer account. Avoid claiming that the last page viewed “caused” a purchase. Use coarse, consented campaign identifiers where appropriate and report assisted journeys separately from direct conversions.
Do not join sandbox behavior to a CRM identity unless the person deliberately submits a contact or creates an account under a documented purpose. Keep anonymous product events separate. A qualified handoff can pass the product and selected plan context without copying the visitor’s detailed admin activity.
Segment only when the cohort can support a decision
Useful segments may include product, blueprint version, new versus returning session when privacy permits, broad device class, launch capacity state and experiment variant. Avoid high-cardinality URLs, exact timestamps or rare combinations that make individuals identifiable. Suppress or combine very small cohorts.
Write the decision each segment supports. Device class may guide responsive onboarding; blueprint version may explain a completion shift. A segment that exists only because analytics can collect it adds privacy and interpretation cost.
Set data-quality alerts
Alert when accepted launch requests and launch events diverge, impossible event orders appear, duplicate rates rise, required properties disappear, one product stops reporting, or unknown properties enter the payload. Compare client and server timestamps within expected bounds and use ingestion time for late-event monitoring.
Quarantine events that fail the dictionary instead of accepting arbitrary fields. A release should not silently create a new property containing form text or error dumps. Provide a visible data-quality status on reports so teams do not optimize against broken measurement.
Use cohort and survival views carefully
When session length varies, show completion by elapsed time since usable login rather than clock time alone. This reveals whether visitors need more time or encounter an early wall. Extension requests can indicate useful exploration, slow product processing or unclear onboarding; combine them with action states and qualitative evidence.
Do not treat every exit as abandonment. A visitor may get an answer from a report and leave without triggering a commercial handoff. Define successful terminal states for each journey, including “evaluated and not suitable” when explicit feedback supports it.
Review the whole funnel after platform changes
A new CDN, login flow, capacity limit or cleanup scheduler can change downstream metrics without touching the plugin. Annotate infrastructure releases and compare every funnel stage. If fewer users reach the first action because automatic login slowed, rewriting the product tour addresses the wrong layer.
Run a synthetic journey before and after major platform changes and retain its timestamps. Separate synthetic sessions in reports but use them as an operational baseline. A stable product funnel requires the surrounding demo service to remain stable.
Define decision thresholds before reporting
State what result triggers rollback, more research, rollout or no action. For a launch experiment, a material reliability decline may force rollback regardless of completion. For onboarding copy, require a minimum observation window and no worsening of errors or accessibility. Thresholds reduce the temptation to reinterpret noise.
Low-volume products may never support narrow statistical claims. Use repeated usability tests, support evidence and large directional changes. Say when uncertainty is high. Honest limits are more useful than a precise percentage with an unstable denominator.
Maintain a monthly measurement review
Bring product, platform, privacy and support owners together with the metric dictionary and decision log. Review reliability first, then journey behavior, then qualified handoff. Assign one change per verified problem and avoid simultaneous experiments on the same step.
Close obsolete events, examine access and retention, review experiment status and test a sampled event end to end. The meeting should produce owners and deadlines, not a larger dashboard. Measurement earns its cost when it changes a seed, flow, capacity rule or product decision.
Calculate funnels with stable session states
Represent each session once at its furthest valid stage during the reporting window. A visitor who retries an action five times should not become five completions. Define how resets, extensions, concurrent tabs and returning sessions affect the key. Use server-issued anonymous session IDs with short retention rather than browser fingerprints.
Late events need a cutoff and revision policy. Operational dashboards may update immediately, while weekly product reports can wait for a bounded delivery window. If a late event changes a published number, mark the revision rather than silently rewriting history.
Connect error categories to reproducible tests
Keep error properties coarse—provisioning timeout, capacity rejected, login failed, validation failed, provider unavailable—then link each category to internal logs using a protected job identifier. Product analytics does not need stack traces or user input. Operators can use the restricted record to reproduce the exact stage.
Review the top error categories by impact and age. Create a test for every resolved systemic failure, and confirm the category falls after release. If “unknown” grows, improve classification before drawing product conclusions.
Protect accessibility in measurement design
Do not infer successful use from mouse-only clicks. Track validated outcomes regardless of whether the visitor used keyboard, touch or assistive technology. Feedback widgets and consent controls must be keyboard accessible, clearly labeled and optional where appropriate.
Include accessibility defects and blocked journeys as guardrails. A tour that increases completion by trapping focus or obscuring controls has failed. Pair aggregate measurement with periodic accessibility testing on the actual sandbox flow.
Retain one fully verified event trace per product as a regression fixture for every analytics release.
Keep the metric dictionary accessible beside every internal report.
How WPStack Sandbox Manager helps
WPStack Sandbox Manager already manages isolated session creation, automatic login, countdown, extensions, reset, expiry, visitor rate limits, global capacity and deletion. Those lifecycle boundaries provide reliable places to count aggregate operational events without inspecting the content a visitor enters.
Product-specific feature events require deliberate integration and consent decisions. Keep the default minimal; do not turn a demo sandbox into session-surveillance software.
Demo quality scorecard
- launch success and p95 launch time;
- automatic-login success;
- percentage reaching first key action;
- percentage completing the primary outcome;
- error rate by non-sensitive category;
- reset and extension rate;
- cleanup success and time to deletion;
- qualified documentation, pricing or contact handoff.
Related WPStack guides
Frequently asked questions
Should we record demo sessions?
Usually no. Begin with aggregate, allowlisted events. Recording admin activity can capture sensitive user input and credentials.
Is session duration a conversion metric?
It is context, not success by itself. Pair it with meaningful actions and outcomes.
How do capacity limits affect analytics?
Report rejections separately. Otherwise infrastructure shortage can look like product abandonment.
What should happen to expired-session data?
Delete sandbox content through the lifecycle policy and retain only minimal aggregate metrics for a documented period.
References

Aditya Bhimrajka is a technology entrepreneur, product strategist, and software solutions expert with over a decade of experience building scalable web and mobile applications. His expertise spans SaaS, AI, cloud technologies, custom software development, and digital transformation. Passionate about solving real-world business challenges through technology, Aditya shares practical insights on WordPress, plugins, software development, startup growth, product strategy, and emerging technologies. At WPStack, he writes actionable, experience-driven content that helps developers, businesses, and website owners build secure, high-performing, and future-ready WordPress solutions.