
How to Catch Intermittent WordPress Performance Spikes
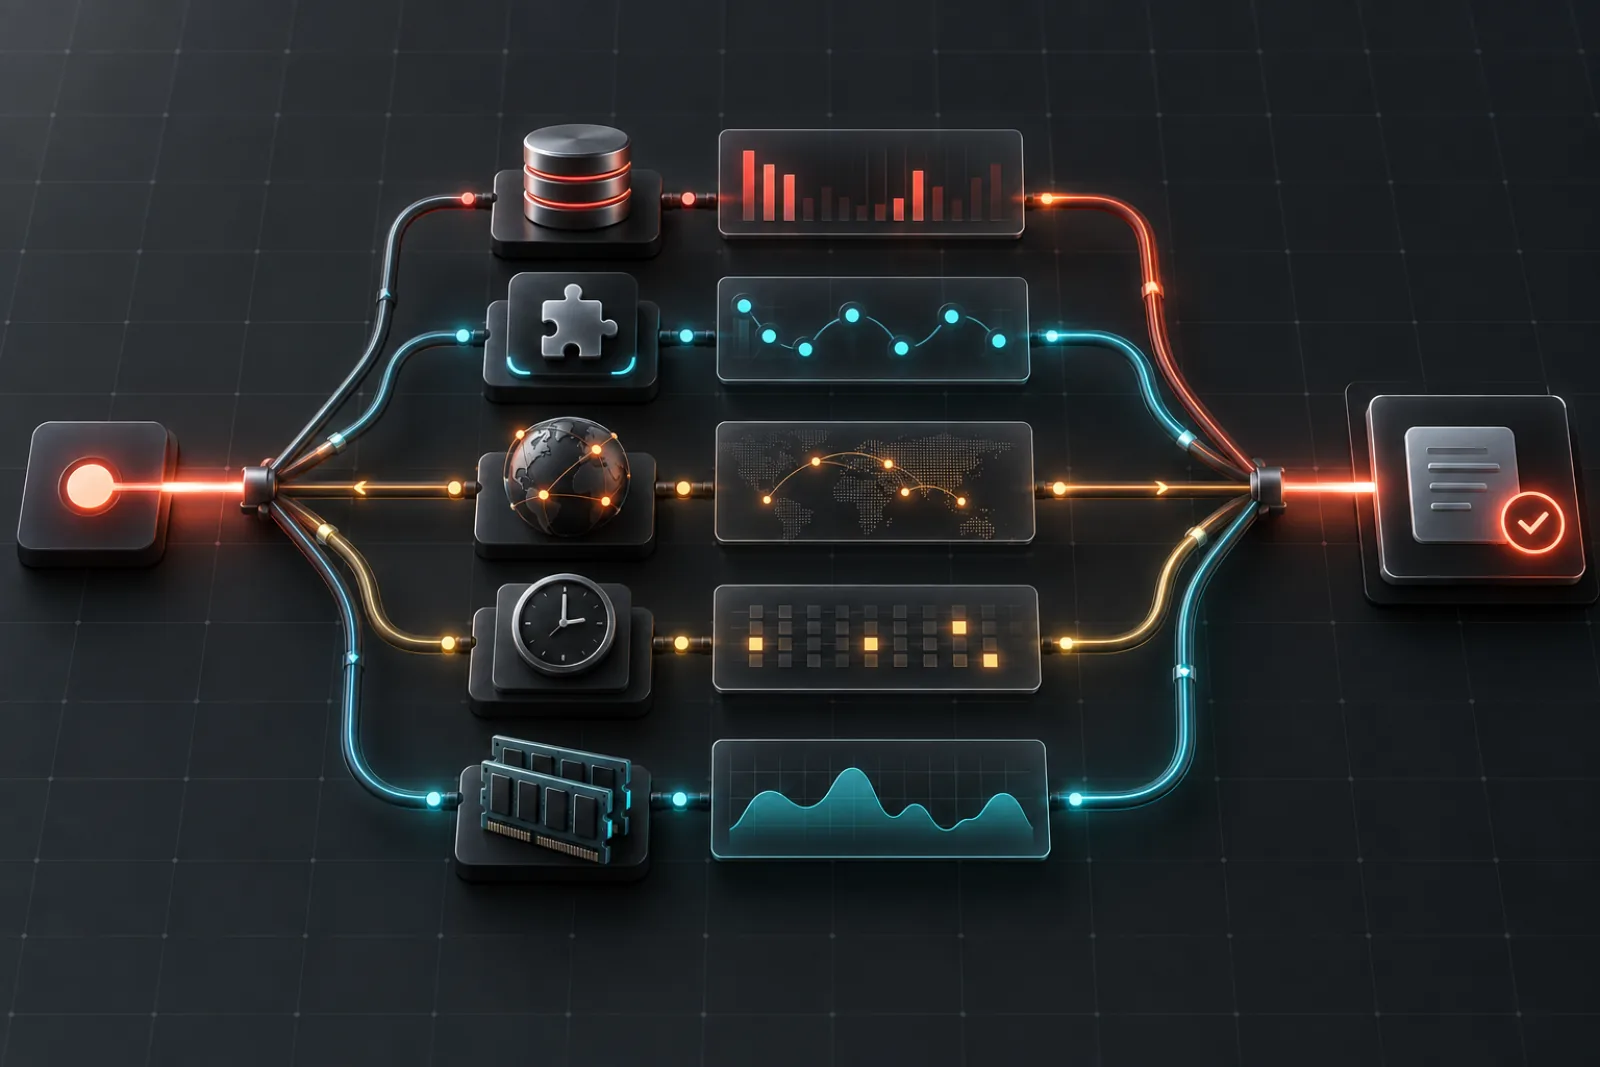
If WordPress becomes slow for ten minutes and then recovers, a test performed an hour later cannot explain the incident. Intermittent performance spikes require a timeline: timestamped request snapshots, scheduled activity, database and PHP-worker metrics, traffic, remote API timing, memory and errors. The root cause is the event that changes when the site changes—not the component that merely happens to be installed.
This guide focuses on periodic and apparently random incidents: brief CPU surges, wp-admin freezes, checkout timeouts, bursts of 500 errors, high PHP memory, or a site that is fast during every manual test but unreliable in production. For the broader request-level workflow, use WPStack’s guide to diagnosing slow WordPress requests.
Why intermittent WordPress slowness is different
A consistently slow page can be reproduced and profiled on demand. A spike may depend on a due cron event, queue backlog, cache expiry, external timeout, crawler burst, backup, import, database lock or exhausted PHP-worker pool. Removing one plugin during a quiet period can appear to fix the problem even when the triggering condition simply did not recur.
| Pattern | High-value hypotheses | Evidence to correlate |
|---|---|---|
| Spike at roughly the same time each day | Backup, report, feed sync, cleanup or system cron | Job schedules, execution logs, CPU, disk and database activity |
| Spike after publishing or importing | Cache purge, indexing, image work, webhooks or large metadata writes | Post-save request, background queue and downstream API timing |
| Spike after cache expiry or deployment | Cold object/page cache, template compilation or cache stampede | Hit/miss state, concurrent requests and cache rebuild duration |
| Random 20- or 30-second admin waits | Remote HTTP timeout or retry | Destination URL, duration, response/error and initiating callback |
| Traffic burst followed by 502/503 errors | PHP-worker saturation, database connections or origin throttling | Arrival rate, worker queue, process count and origin status |
| Memory climbs during one job type | Unbounded batches, large result sets or image processing | Peak memory by request context and records processed |
Build a shared incident clock
Every evidence source needs a timestamp and timezone. WordPress may display a site timezone while PHP, MySQL, the web server, CDN and hosting dashboard use UTC or server local time. Normalize them before drawing conclusions.
For each incident, record:
- start and end time;
- affected URLs or actions;
- anonymous, authenticated, REST, AJAX or cron context;
- response codes and visible symptoms;
- cache hit or miss when known;
- deployment, update, publish or import events nearby;
- PHP workers, CPU, memory, database connections and disk activity;
- request-level query, HTTP, hook and error evidence.
Without a shared clock, two charts that peak “around midnight” may describe events separated by hours.
Capture a normal window and a spike window
An isolated slow request has no local baseline. Retain a bounded set of normal requests for the same route and context, then compare the incident against that population. A checkout request should not be judged against a cached article, and wp-admin should not share a single threshold with cron.
The WordPress Core Performance Handbook recommends using several requests because measurements naturally vary. It also distinguishes profiling, which helps explain why work is slow, from benchmarking, which compares how well two states perform. Use profiling during the incident to narrow the cause; use repeatable benchmarks after the change to verify the outcome.
Compare distributions, not only averages
A mean can hide rare failures. Track median behavior along with upper percentiles, maximums and error rate. If 95 requests complete in 300 ms and five time out at 20 seconds, an average alone understates the user impact.
Separate route families
Group comparable requests: public frontend, uncached commerce, wp-admin, REST, AJAX and cron. Within each group, retain the route or action name. This prevents naturally expensive operations from being flagged as anomalies simply because they differ from lightweight pages.
Correlation 1: scheduled tasks and queues
WordPress uses WP-Cron for time-based tasks, including scheduled publishing. The official handbook explains that due events are checked on page load and run at the next opportunity; WP-Cron is not a continuously running system scheduler.
During a spike, identify the actual callback and workload:
- scheduled time, actual start and finish;
- recurrence and whether previous executions overlap;
- records or files processed per batch;
- database queries, external calls and peak memory;
- retry behavior and queue age;
- whether multiple nodes or requests can claim the same job.
Do not disable WP-Cron as a diagnostic reflex. Without a reliable replacement, scheduled posts and maintenance can run late. If traffic-triggered cron is unsuitable, configure a system or hosting scheduler to invoke WordPress at the required interval, verify execution, and only then disable page-load triggering.
Correlation 2: remote API timeouts
Licensing, payment, shipping, email, analytics, update and AI services can add blocking waits to WordPress requests. The http_api_debug hook exposes responses from the WordPress HTTP API, including the destination and request context.
A remote dependency is a strong candidate when the spike duration clusters around a fixed timeout such as 5, 10, 20 or 30 seconds. Check whether:
- the same endpoint is called repeatedly;
- a transient or object-cache entry expired immediately before the spike;
- failed calls retry without backoff;
- every visitor is rebuilding the same missing cache;
- the result could be refreshed asynchronously;
- the feature fails safely when the provider is unavailable.
Blocking all external HTTP may make a test faster, but it can also break critical integrations. Trace the caller and purpose, then repair scope, caching, timeout or background synchronization.
Correlation 3: database saturation and locks
A request snapshot can show its slow and duplicate queries, but intermittent database incidents may involve other concurrent work. Match WordPress timestamps to MySQL slow logs, active connections, lock waits and server load.
Distinguish three patterns:
- One expensive query: examine the execution plan, rows examined, filters, ordering and indexes.
- Repeated application queries: group duplicate shapes and trace the call site for an N+1 loop or missed cache.
- Normally fast queries becoming slow together: investigate locks, disk pressure, connection saturation or competing jobs.
Optimizing one query will not fix a database server that is waiting on another transaction or starved of resources.
Correlation 4: cache expiry and stampedes
A cold cache is expected to do more work. A stampede occurs when many requests discover the same missing value and all rebuild it concurrently. Common triggers include cache purges, deployments, expiry boundaries and object-cache restarts.
Compare the first miss, concurrent misses and later hits. The fix may require a lock, stale-while-revalidate strategy, pre-warming, randomized expiry or smaller rebuild batches. Increasing cache duration alone can postpone the next spike without preventing it.
Correlation 5: PHP workers, memory and traffic
An incoming request can wait before WordPress begins if all PHP workers are occupied. This queueing delay may not appear inside an application runtime measurement. Compare origin response timing with worker utilization and process counts.
Memory evidence also needs context. Peak memory for a request is not automatically a leak. Relate it to the job type, input size and concurrency. An import that loads 50,000 records at once may need bounded batches; five simultaneous image jobs may individually fit while collectively exhausting the host.
Turn the incident into a test
Once one hypothesis explains the timing and mechanism, reproduce it safely:
- Copy representative data to staging.
- Trigger the same request, job, cache miss or API failure.
- Capture the original runtime, queries, memory and errors.
- Change one variable: batch size, schedule, cache lock, query, timeout or callback scope.
- Repeat multiple times with comparable conditions.
- Test adjacent workflows, including publishing, checkout, webhooks and scheduled posts.
- Deploy with rollback and observe the next expected incident window.
Decompose the latency across infrastructure layers
A browser’s total wait can include DNS, TLS, CDN processing, origin queueing, PHP execution, database waits and transfer. WordPress instrumentation begins only after the request reaches PHP. If the browser reports 12 seconds while the captured WordPress runtime is 600 milliseconds, investigate the missing 11.4 seconds before optimizing plugin hooks.
| Layer | Evidence | Intermittent failure pattern |
|---|---|---|
| DNS/TLS/CDN | Browser waterfall, CDN logs, edge status | Regional routing, handshake or edge-origin timeout |
| Web server/PHP queue | Access timing, PHP-FPM status, worker queue | Requests wait before WordPress starts |
| WordPress/PHP | Request snapshots, hook and memory timing | One callback, loop or batch expands |
| Database | Slow log, active transactions, lock waits | Normally fast queries stall together |
| Remote service | HTTP destination, duration and response | Fixed timeout or retry wave |
| Browser | Performance trace and long tasks | HTML arrives quickly but interface freezes |
Use a correlation ID where possible. Add it to application logs and response headers without exposing secrets. It lets hosting support, CDN logs and WordPress snapshots describe the same request rather than merely nearby timestamps.
Create an incident capture runbook
Write the procedure before the next spike. Identify who checks the host dashboard, who captures WordPress evidence, where timestamps are recorded, and which emergency controls are allowed. Include commands and dashboard locations that are safe to run under pressure. Avoid turning on unlimited query logging during an outage; extra diagnostics can worsen disk or database pressure.
- Confirm user impact from a second location or synthetic check.
- Record the exact start time, affected action and response code.
- Capture worker, CPU, memory, disk and database state without restarting services.
- Preserve a bounded sample of slow and normal WordPress requests.
- List jobs, deploys, publishes, imports and cache events near the window.
- Apply only a pre-approved reversible containment if the site is failing.
- Record the recovery time and what changed immediately before it.
A restart may restore service, but it destroys useful process state. When uptime requires a restart, capture what can be collected quickly and treat the restart as containment—not proof that PHP, the database or a plugin was the root cause.
Three worked incident patterns
A daily report overlaps itself
At 02:00 UTC, PHP workers fill and admin requests time out. WordPress snapshots show the same cron callback running in multiple requests. The job processes all customers in one pass and takes longer than its hourly recurrence after the dataset grows. The team adds a single-owner lock, bounded batches and checkpoints, then schedules a reliable trigger. Verification covers two recurrence cycles and confirms scheduled publishing still works.
A remote license service times out
Every few hours, the Plugins screen waits almost exactly 20 seconds. Request evidence shows four sequential calls to one vendor endpoint after a cached status expires. The public site is mostly unaffected, but administrators report freezes. The owner consolidates the calls, shortens a defensible timeout, serves a stale non-critical result and refreshes it asynchronously. Tests simulate 200, 429, 500 and timeout responses.
A cache purge creates a stampede
After a content deployment, hundreds of visitors simultaneously miss a costly generated navigation object. CPU and database queries surge for two minutes, then the site becomes fast. The fix is not a longer cache lifetime alone. The team adds a rebuild lock, serves the last valid value while one worker refreshes it, randomizes dependent expirations and pre-warms priority pages. A concurrency test proves only one rebuild occurs.
Design experiments that can disprove your hypothesis
A useful hypothesis predicts what evidence should change. If overlapping cron owns the spike, preventing overlap should reduce concurrent callbacks and worker occupancy during the next window. If a remote timeout owns it, a controlled failing endpoint should reproduce the duration. Define evidence that would refute the theory; otherwise every result can be interpreted as confirmation.
Change one variable and retain the same workload. Do not update WordPress, change hosting, install caching and reschedule jobs simultaneously. When several emergency changes were unavoidable, roll them into staging one at a time afterward to learn which mechanism mattered.
Privacy and storage controls for diagnostics
Request paths, query arguments, HTTP payloads and error messages can contain customer IDs, emails, tokens, order information or form content. Capture names and timing by default, not full values. Redact authorization headers, cookies, nonces and credentials before storage. Restrict access, define retention, and remove intensive traces once the investigation ends.
Bound every collection dimension: maximum snapshots per minute, queries and hooks per snapshot, retained days, payload length and disk usage. Monitoring that grows without limits can become the next intermittent incident.
Build alerts around symptoms and mechanisms
Use a small set of alerts that lead to action. Availability and error-rate alerts describe user impact. Worker queue, database lock, cron backlog and remote-timeout alerts describe mechanisms. Route-specific latency alerts keep a slow checkout from disappearing inside a fast cached-page average. Attach a runbook, owner and evidence link to every alert.
Avoid thresholds copied from unrelated sites. Observe normal distributions by route and time period, then choose a threshold that catches meaningful deviation without paging on routine maintenance. Include both magnitude and duration so one harmless slow request does not trigger the same response as a ten-minute outage. Test the notification path; an alert that reaches an abandoned inbox is not monitoring.
Definition of done for an intermittent incident
Do not close the investigation because the site is currently fast. Completion requires a mechanism that explains the onset, duration and recovery; a reproducible or strongly correlated test; a scoped change; and observation through the next expected trigger window. Record what evidence would reveal recurrence.
- The incident timeline uses one timezone and names every evidence source.
- The affected request family has a normal baseline and upper-percentile comparison.
- The suspected callback, query, dependency or resource queue matches the incident duration.
- The fix has a rollback and does not disable unrelated scheduled or customer workflows.
- Monitoring confirms the mechanism changed, not merely the homepage response.
- Diagnostic data is bounded, redacted and scheduled for cleanup.
- A short incident note preserves the cause, decision and verification for the next operator.
If the trigger cannot be reproduced, state the remaining uncertainty. A well-instrumented hypothesis with a recurrence plan is more useful than a confident but unsupported root-cause label.
Post-incident review questions
Within a few days, review whether detection occurred before customer reports, whether clocks and correlation IDs were usable, and whether the team captured evidence before restarting services. Identify which dashboard or log was missing and add only the smallest durable instrumentation needed. Review why the workload changed: more records, new traffic, a vendor slowdown, a deployment, an expired cache, or a job whose duration gradually approached its recurrence.
Assign preventive work separately from the immediate fix. A lock may stop overlap while the underlying job still needs batching; a stale response may protect users while the external integration still needs retry limits. Track both commitments. Finally, update capacity assumptions and the runbook with the measured incident, then rehearse the capture procedure in staging so the next responder is not inventing it during an outage.
Keep the review blameless and evidence-led. The useful outcome is a system that detects, contains and explains the next abnormal window faster, not a narrative that assigns certainty where the telemetry was incomplete.
Using WPStack TOP Load Monitor for short-lived spikes
WPStack TOP Load Monitor records timestamped, bounded request snapshots containing runtime, memory, slow and duplicate queries, caller context, hooks, HTTP API activity, cache state, cron signals and PHP errors. Its timeline helps preserve application evidence after a short spike has passed.
Configure collection for the incident rather than recording everything forever:
- sample traffic on busy sites;
- set retention long enough to cover the spike cycle;
- cap queries and hooks per snapshot;
- enable only useful tracking modules;
- separate alert thresholds by what normal traffic actually looks like;
- reduce intensive monitoring after the mechanism is confirmed.
The monitor provides WordPress-level evidence. It cannot see CDN queueing, every database lock, operating-system scheduling or browser main-thread work. Correlate its timestamps with the hosting and browser layers instead of treating one dashboard as the whole system.
If the evidence points to one component rather than a time-based incident, continue with WPStack’s controlled workflow for identifying a slow WordPress plugin. Repeat the comparison after cache expiry and normal scheduled work so a temporary quiet window is not mistaken for a durable correction.
Common mistakes
- Testing only after recovery: the triggering state has already disappeared.
- Blaming the job nearest the spike: require matching duration, resource use and reproducibility.
- Using one global threshold: request families have different normal behavior.
- Confusing application runtime with queue time: saturated workers can delay execution before instrumentation begins.
- Disabling cron without replacement: this creates late scheduled posts and maintenance.
- Retaining unlimited diagnostics: observability needs sampling, caps and cleanup.
Related WPStack guides
Keep one representative trace from before and after remediation so later regressions can be compared against evidence rather than memory.
Frequently asked questions
Why is WordPress randomly slow?
The cause is often not random. It may align with cron, cache expiry, traffic, remote timeouts, backups, imports, locks or worker saturation. Normalize timestamps and compare incident windows.
Can WP-Cron cause CPU spikes?
A due callback can consume CPU, memory or database capacity, but the scheduler check alone does not prove responsibility. Identify the callback, workload, overlap and runtime.
Why does the site recover without a change?
A remote timeout ends, a queue drains, a lock releases, traffic falls, workers restart or a cache becomes warm. Recovery is part of the pattern and should be captured.
How long should monitoring data be retained?
Long enough to include at least one expected incident cycle, with sampling and storage caps appropriate to traffic. Remove or reduce detailed collection once the issue is resolved.
Does a memory spike prove a leak?
No. It proves high allocation during the observed request. Compare request types, input size, repetition and process behavior before diagnosing a leak.
How do I verify an intermittent fix?
Reproduce the trigger on staging, repeat comparable benchmarks, deploy with rollback, and observe at least the next period when the spike would normally recur.
Incident checklist
- Normalize timestamps and timezones.
- Record the affected route, context and cache state.
- Compare normal and spike windows.
- Correlate cron, HTTP, database, cache, memory, traffic and workers.
- Form one mechanism-based hypothesis.
- Reproduce it with representative data.
- Change one variable and repeat the test.
- Verify scheduled posts and critical workflows.
- Observe the next expected incident window.
References
- WordPress Core Performance Handbook: Profiling vs benchmarking
- WordPress Core Performance Handbook: Performance measurement practices
- WordPress Plugin Handbook: WP-Cron
- WordPress Developer Reference:
http_api_debug - WordPress support case: periodic process and memory spikes

Aditya Bhimrajka is a technology entrepreneur, product strategist, and software solutions expert with over a decade of experience building scalable web and mobile applications. His expertise spans SaaS, AI, cloud technologies, custom software development, and digital transformation. Passionate about solving real-world business challenges through technology, Aditya shares practical insights on WordPress, plugins, software development, startup growth, product strategy, and emerging technologies. At WPStack, he writes actionable, experience-driven content that helps developers, businesses, and website owners build secure, high-performing, and future-ready WordPress solutions.