
WordPress CPU Spikes With No Traffic: A Root-Cause Workflow
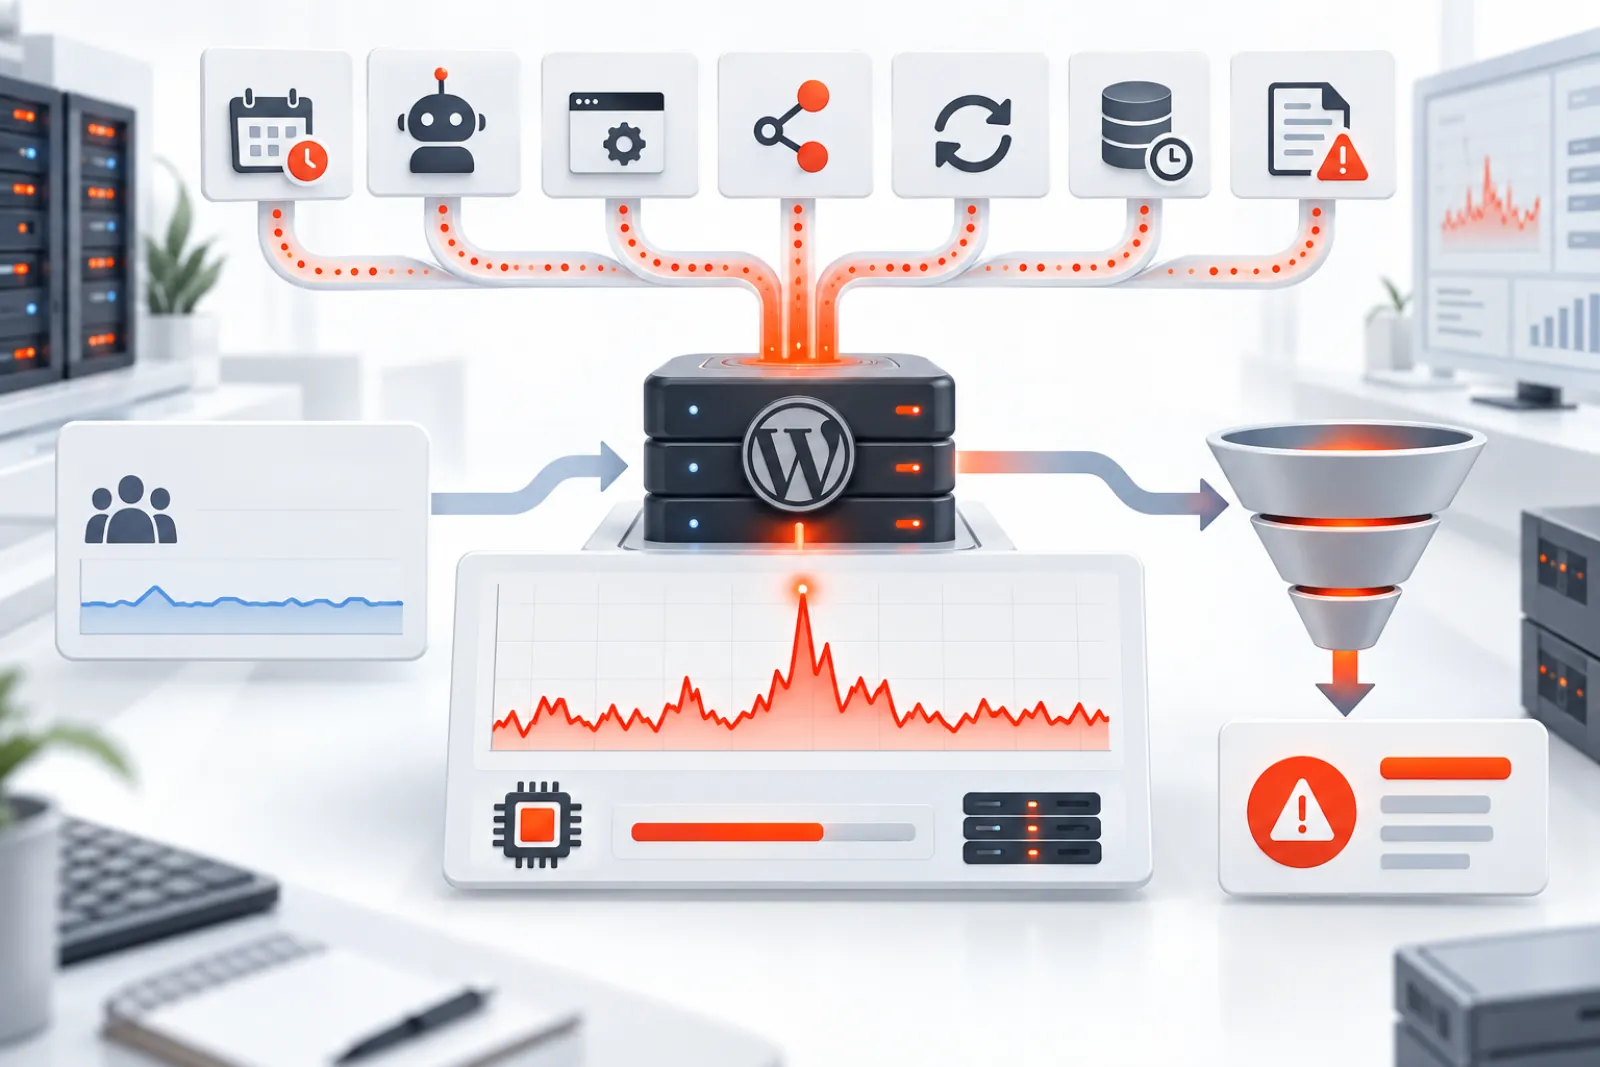
Low human traffic does not mean WordPress is idle. WP-Cron, bots, uptime checks, REST clients, admin-ajax.php, loopbacks, backups, imports and PHP retry loops can keep workers busy without appearing in an analytics dashboard. Diagnose the requests and processes present during the spike before changing caches or server size.
Confirm what “CPU spike” means
Record the affected host, timestamp, duration, CPU percentage, load average, running PHP workers, memory pressure, disk I/O and database activity. A one-minute chart cannot distinguish one CPU-bound process from twenty requests waiting on disk. Ask the host for process and request evidence, not only a screenshot.
| Evidence | Likely path | Next check |
|---|---|---|
wp-cron.php requests | Scheduled work | Due hooks, runtime and overlap |
Repeated admin-ajax.php | Heartbeat or plugin polling | Action name, user and frequency |
| Front-controller requests from few agents | Bots, monitors or retrying clients | Access logs and firewall outcome |
| PHP workers busy with low DB time | Filesystem, CPU loop or external wait | Profiler, stack and HTTP calls |
| Database CPU rises with PHP | Heavy or repeated SQL | Slow log, query shape and caller |
Build a five-minute evidence bundle
- Export access-log lines around the spike.
- Group by path, status, user agent and source—not only page views.
- List WordPress snapshots for the same timestamps.
- Identify slow queries, duplicate patterns, hook time, HTTP calls and PHP errors.
- List due cron or queue jobs and their owners.
- Compare hosting CPU, worker and database graphs.
Investigate hidden traffic
Analytics can exclude bots, API calls, failed requests, cached pages and wp-admin. Check raw logs for crawlers repeatedly fetching uncached search, feed, XML-RPC, REST or preview URLs. A firewall challenge can cause a legitimate crawler to retry. Rate-limit the abusive path or fix the loop; do not block all bots or APIs without understanding business impact.
Investigate scheduled and background work
WordPress checks scheduled tasks through WP-Cron and may spawn a loopback request. Identify the exact callback rather than blaming the scheduler. Backups, image processing, reports, imports, email batches and cleanup can each consume CPU. Check whether a job exceeds its interval, runs concurrently, retries immediately or was scheduled thousands of times.
Investigate PHP errors and loops
Repeated warnings can create log I/O; a retry loop can consume a worker; expensive filesystem scans may not appear in query timing. Correlate error file and line with request paths. Temporarily increasing memory or execution time can make a runaway process last longer, so treat limit changes as controlled diagnostics.
Separate CPU work from waiting
A process shown as “busy” is not necessarily consuming CPU continuously. Inspect user CPU, system CPU, I/O wait and elapsed time. A remote call may occupy a PHP worker without burning CPU; image compression or a runaway loop usually consumes CPU directly; a slow disk can raise load average while processors remain partly idle. The remedy depends on the resource actually saturated.
Sample more than once during the incident. A single process list can catch the aftermath rather than the cause. Preserve process IDs, command lines and request correlation where hosting permits.
Check multisite and shared-host boundaries
On Multisite, attribute requests and cron work to the correct site. On shared hosting, another site under the account—or another tenant on the node—can affect the same limits. Ask whether CPU charts are account-level, container-level or physical-host metrics. Do not deactivate plugins on the wrong WordPress instance to chase a shared resource incident.
Remediation ladder
- Stop a confirmed runaway or abusive source with the narrowest reversible control.
- Repair duplicate scheduling, retry logic or uncached remote work.
- Batch expensive maintenance and move it away from peak periods.
- Cache safe public responses and rate-limit abusive dynamic routes.
- Optimize the measured query, hook or algorithm.
- Increase capacity only after estimating the remaining legitimate workload.
Worked example
Traffic analytics shows 20 visitors, but access logs contain 9,000 REST requests from a sync client after repeated 429 responses. Snapshots show low query time but long plugin hook time. The fix is to repair client backoff and cache the appropriate response—not to disable WP-Cron or buy a larger database.
Verify the fix
Repeat the same log grouping and compare spike frequency, p95 request runtime, PHP worker occupancy, database time and errors across a representative window. Confirm the blocked or changed source still performs its business purpose. Keep an alert on recurrence; a quiet fifteen minutes is not proof when the original job ran daily.
Correlate outside the web-access log
Build one timestamped timeline from PHP-FPM, database, system scheduler, WP-Cron, backup, malware scan and queue-worker logs. Normalize time zones and clock drift first. A spike with no page traffic may align with command-line work, a loopback request, database maintenance or a file scan. Confirm the responsible process and stack before disabling a plugin; coincidence alone is not root-cause evidence.
Separate host metrics from WordPress evidence
CPU percentage has a denominator. One saturated core can appear as 100% in one dashboard and 12.5% on an eight-core host. Load average includes runnable and sometimes uninterruptible work; it is not the same as processor utilization. I/O wait, steal time, throttling and memory pressure can make requests slow with different CPU signatures.
Record the metric source, sampling interval and resource boundary. Shared hosting may report account seconds, a container may have quotas below the physical machine, and managed platforms may aggregate several PHP pools. Match the host’s definition before comparing WordPress request times.
| Host signal | Interpretation clue | WordPress correlation |
|---|---|---|
| High user CPU | Application or compression work | PHP stacks, image jobs, loops and expensive algorithms |
| High system CPU | Kernel, networking or filesystem activity | Log storms, file scans, cache or storage operations |
| High I/O wait | Processes blocked on storage | Backups, malware scans, database or slow disk |
| High load with moderate CPU | Queued runnable or blocked tasks | Worker count, storage and database contention |
| CPU throttling or steal | Quota or noisy-neighbor constraint | Ask host for container or node evidence |
Build an incident timeline before changing the site
Normalize all timestamps to UTC and note clock drift between web, database, cache and monitoring systems. Mark spike start, peak and recovery. Add deployments, plugin updates, cron starts, queue batches, backup windows, bot bursts, administrator actions and external-service incidents.
For each minute, record request rate, uncached request rate, PHP worker occupancy, CPU, memory, database queries, slow external calls and errors. The timeline often reveals that “no traffic” means no analytics page views while a REST client or cron loop dominates.
Preserve evidence before restarting services or clearing queues. A restart can restore availability but erase the process and stack needed to identify the cause.
Group raw requests by cost, not only count
Aggregate path, method, status, user agent, source group, response time and response bytes. Multiply frequency by measured application cost to find the largest consumers. Ten expensive uncached searches may cost more than ten thousand cached asset requests.
Separate cache hits, cache misses, authenticated traffic, REST, AJAX, XML-RPC, login attempts, previews and loopbacks. Preserve query strings only after redacting tokens and personal data; group parameterized routes into safe patterns. A single abusive search expression can create a high-cost database path.
Inspect every background execution system
List due and overdue WP-Cron hooks with recurrence, arguments and owner. Also inspect Action Scheduler or plugin-specific queues, hosting cron, backup agents, malware scanners and command-line imports. WP-Cron is only one source of background work.
Record actual start, finish, peak memory, processed items and result. Look for duplicate schedules, runtime longer than interval, immediate retries, missing locks and backlogs released at once. If a job runs via loopback, correlate its request with the callback rather than treating it as anonymous traffic.
Find request loops and self-generated traffic
A plugin can call the site’s REST API, admin AJAX or a public URL from inside another request. Redirects, health checks and webhook retries can create loops that analytics ignores. Look for the server’s own IP or hostname, repeated correlation IDs and regular intervals.
Fix loop termination, authentication or retry backoff at the source. Blocking the server’s address at the firewall can break legitimate loopbacks and scheduled publishing. Use the narrowest route and caller control.
Distinguish CPU-bound PHP from occupied workers
A slow external API may hold every PHP worker while using little CPU. New requests queue, and a host dashboard may show intermittent CPU around connection setup and response parsing. Conversely, image generation, regex over large content, encryption or an infinite loop can consume processor continuously.
Sample process CPU and stack several times. Compare elapsed and CPU time. Use an application profiler on staging to locate expensive functions, but avoid enabling high-overhead tracing blindly during a production spike. A low-overhead request snapshot with exact timestamps can bridge hosting and application evidence.
Investigate the database only when evidence points there
Correlate database CPU, active connections, lock waits and slow queries with the incident. Normalize similar queries and rank total time, not just the slowest individual call. A fast query repeated fifty thousand times can dominate load.
Trace the caller and route before adding an index. Confirm the execution plan and data distribution on staging. Avoid generic “database optimization” or table cleanup during an active incident unless the specific contention is proven and rollback is clear.
Worked case: a broken uptime monitor
An uptime service checks a dynamic search URL every second from three regions after a configuration change. The page bypasses cache and performs a complex query. Analytics excludes the bot, so reports show almost no visitors while PHP and database CPU rise every minute.
Access-log grouping identifies the route and user agent. The team restores a lightweight health endpoint, reduces frequency and rate-limits the expensive search pattern. It verifies monitoring still detects outages. Buying more CPU would have funded a broken check.
Worked case: image regeneration after midnight
A plugin update registers new image sizes and a background job regenerates twenty thousand attachments. CPU spikes nightly because the job restarts from zero after its execution limit. Logs show repeated thumbnail work and no progress cursor.
The owner stores a checkpoint, processes bounded batches, excludes already completed files and caps concurrency. The job moves to a low-traffic window. Verification confirms expected sizes, stable memory and completion without overlap.
Apply emergency controls safely
When availability is at risk, pause the confirmed job, rate-limit the exact abusive route, disable the specific failing integration or reduce queue concurrency. Record the change, owner and rollback. Preserve scheduled posts, payments, backups and authentication paths.
Do not deactivate every plugin, disable cron globally or block REST without understanding consequences. Emergency containment should be narrow enough that the site’s essential business still functions while diagnosis continues.
Verify root cause with a falsifiable test
State the hypothesis: “hook X creates the spike because N runs overlap and each consumes Y CPU seconds.” Predict what will change after one controlled correction. Apply it on staging or a production canary, then compare the same metrics and window.
If CPU stays high, the hypothesis is incomplete. Restore or retain only changes with measured effect, and investigate the next contributor. Avoid stacking caching, capacity and plugin changes simultaneously; that makes cause impossible to attribute.
Set monitoring for recurrence
Alert on sustained CPU with request context, worker saturation, job runtime approaching interval, backlog growth, error loops and expensive-route frequency. Include timestamps and links to logs. Use an observation window covering the original daily, weekly or monthly trigger.
Review after deployments and infrastructure changes. Keep one sanitized incident bundle as a regression fixture. The goal is not a permanently flat CPU graph; it is explainable, bounded work that completes without harming user paths.
Investigate bots without blocking useful discovery
Classify known search crawlers, uptime services, link preview agents, SEO tools, vulnerability scanners and unknown automation. Verify claimed search bots through the provider’s documented method; user-agent text can be forged. Group request paths and response codes to see whether a crawler is trapped in calendars, faceted search, feeds or error redirects.
Use robots directives for cooperative crawling, canonical and navigation fixes for URL explosions, and firewall or application rate limits for abusive behavior. Protect login, XML-RPC and expensive search routes with narrowly tested controls. Do not block all APIs or search engines because one source is costly.
Protect privacy while collecting diagnostics
Access logs and request snapshots can contain IP addresses, account paths, search terms, order identifiers, nonces and tokens. Restrict access, set retention and redact query parameters before sharing. Store caller and performance metadata without response bodies or complete form payloads.
When using a profiler or optional analysis service, confirm what code, URLs and database patterns leave the server. Use a staging reproduction with synthetic data where possible. Debugging a CPU spike does not justify copying customer information into a vendor ticket.
Estimate legitimate capacity after remediation
Once waste is removed, measure CPU seconds, memory and worker time per representative public request, checkout, API call and background batch. Multiply by expected concurrency and scheduled workload, then add headroom for traffic bursts, deployments and cache loss. Capacity planning starts from the remaining real work.
Scaling can be correct when the load is legitimate and optimized. Document the assumption and alert threshold. If a single unbounded job can still occupy every worker, more cores only delay the next incident.
Prepare an actionable hosting ticket
Provide timezone-normalized timestamps, affected domain and environment, CPU/load/memory/I/O charts, process samples, PHP worker counts, request groups, database correlation, recent changes and the tests already run. Ask whether metrics are account, container or node scope and whether throttling or other tenants contributed.
Separate facts from hypotheses. “At 02:15 UTC, eight PHP workers ran hook X while user CPU reached the account limit” is useful. “WordPress is randomly using CPU” is not. Redact secrets and customer paths.
Prevent recurring load through development controls
Give background jobs bounded batches, progress cursors, locks, backoff and idempotency. Cache safe results, avoid remote calls during unrelated admin loads, and do not schedule events on every request. Put limits on search, export and bulk operations that scale with untrusted input.
Add a performance test using realistic data volume and concurrency for expensive features. Record expected runtime and peak memory. A release should fail or require review when a job exceeds its interval, a request loop appears or query count grows materially.
Incident closure checklist
- The responsible process, request or job is identified with timestamped evidence.
- Emergency controls are documented and removed or made deliberate.
- The root cause is reproduced and the fix changes the predicted metric.
- Scheduled posts, checkout, login, REST and required background work pass.
- CPU, worker, database, cache and error signals remain healthy through the original trigger window.
- Capacity assumptions and alert thresholds are updated.
- A regression test and owner are recorded.
If no single cause is proven, close separate contributing findings with their evidence rather than inventing certainty. A site can have bot load, cron overlap and constrained workers at the same time.
Worked case: logging turns a warning into an outage
A PHP deprecation fires inside a loop processing product metadata. Production logging records the same warning hundreds of thousands of times, increasing filesystem writes and disk usage. CPU and load climb while page analytics remain quiet because the work runs in a command-line import.
The team identifies the file and line from the first warnings, pauses the import, rotates the oversized log safely and fixes the compatibility defect. It restarts from a checkpoint with rate-limited logging. Verification compares items per minute, disk I/O, CPU and final product counts. Disabling all logging would have removed evidence without repairing the loop.
Maintain a resource decision log
For every remediation, record hypothesis, evidence window, change, predicted effect, actual effect, regressions, owner and rollback. Include decisions not to act, such as retaining a legitimate nightly backup that stays within its resource budget. This prevents future teams from repeating abandoned guesses.
Link capacity changes to the remaining workload model. If a plan is upgraded after waste removal, document expected concurrency and alert thresholds. If the site later exceeds them, the team can distinguish growth from recurrence.
Use representative route health checks
After the incident, monitor one cached public page, one uncached dynamic page, login, REST, admin and a business transaction. Track response, worker queue and errors. A quiet homepage can coexist with a failing checkout or backed-up queue.
Keep health checks lightweight and at a safe frequency; the monitor must not recreate the original load. Review their routes whenever caching or authentication changes.
Define normal background load
Measure a healthy week and label recurring backups, scans, imports and reports. Record their expected CPU seconds, duration and completion evidence. This baseline prevents legitimate maintenance from being misclassified while making deviations obvious.
Update the baseline when data volume, traffic, worker count or schedules change. A job that was safe at ten thousand records may overlap at one million. Forecast from items processed per second rather than waiting for the graph to turn red.
Share the schedule with content and commerce teams so campaigns and bulk imports do not collide with known maintenance. Operational coordination can remove peaks without changing code.
Archive the baseline with named owners and the exact measurement definitions. Reuse it after major releases so normal work, data growth and genuine regressions remain distinguishable.
Retain one annotated incident graph with the matched application timeline. During a future spike, compare paths, jobs and resource shape before repeating remediation. Similar-looking CPU peaks can have different owners, so the artifact is a starting hypothesis, not an automatic verdict.
How WPStack TOP Load Monitor helps
WPStack TOP Load Monitor records sampled request snapshots with runtime, memory, query patterns, caller data, request context and PHP errors. Timeline and anomaly views help match application evidence to the host’s spike window. Sampling means it may not capture every event; retain access and infrastructure logs.
Related WPStack guides
Frequently asked questions
Can WordPress use CPU with zero visitors?
Yes. System cron, loopbacks, queues, bots, API clients and administrators can execute PHP outside measured human sessions.
Should I disable WP-Cron?
Only after identifying cron as a contributor and configuring a reliable replacement. Otherwise scheduled posts and maintenance can stop.
Will page caching solve it?
Only for cacheable public requests. Admin, REST, AJAX, cron and authenticated traffic usually bypass full-page cache.
What should I send hosting support?
Exact timestamps, paths, process samples, worker counts and matching application snapshots.
References

Aditya Bhimrajka is a technology entrepreneur, product strategist, and software solutions expert with over a decade of experience building scalable web and mobile applications. His expertise spans SaaS, AI, cloud technologies, custom software development, and digital transformation. Passionate about solving real-world business challenges through technology, Aditya shares practical insights on WordPress, plugins, software development, startup growth, product strategy, and emerging technologies. At WPStack, he writes actionable, experience-driven content that helps developers, businesses, and website owners build secure, high-performing, and future-ready WordPress solutions.