
Autoloaded Option Count vs Size: What Actually Slows WordPress?
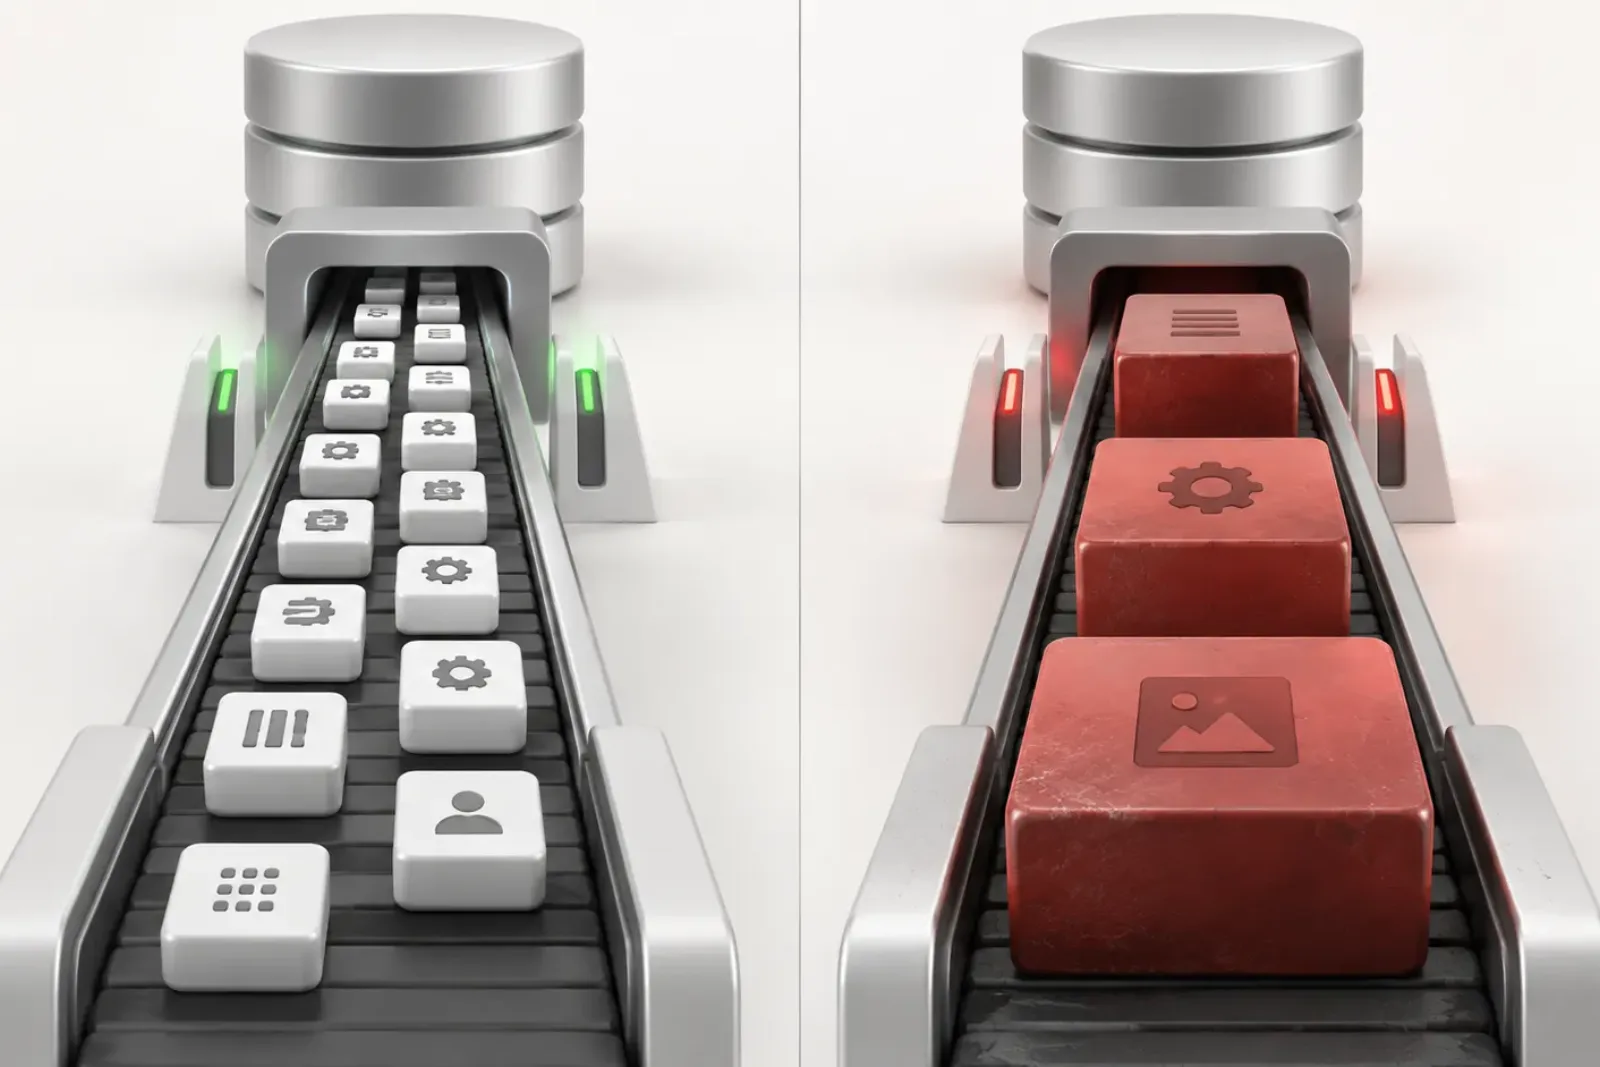
Option count is not a WordPress performance score. A site with 1,200 small autoloaded options may load less data than a site with 80 options containing several large serialized arrays. Count helps describe the database. Total bytes, access frequency, ownership, growth and measured request cost determine whether the autoloaded collection is a real problem.
This distinction matters because Site Health reports can prompt administrators to hunt for a “correct” number of options. WordPress does not define one. The platform instead raises its autoload warning based on the total stored size, and WordPress 6.6 added size-aware behavior for newly updated large options.
Why WordPress autoloads options
A typical request needs several settings before a page can be rendered: URLs, the active theme, active plugins, rewrite configuration, widgets, and plugin settings. Retrieving commonly used values together can be more efficient than asking the database for each value separately.
The collection becomes inefficient when it accumulates values that are large, rarely used, abandoned, or continuously growing. Because the collection is broadly available, the cost is not limited to the plugin settings screen that originally created the option.
Two sites with very different risks
| Signal | Site A | Site B |
|---|---|---|
| Autoloaded rows | 1,200 | 80 |
| Total stored size | 480 KB | 2.4 MB |
| Largest option | 18 KB | 1.7 MB |
| Ownership | Mostly active components | One abandoned plugin cache |
| Growth | Stable | Increasing every week |
These figures are illustrative, not recommended thresholds. Site A has many more rows, but Site B deserves attention first. Its total footprint is larger, one option dominates the collection, the owner appears inactive, and the value continues growing.
Reducing Site A to an arbitrary row target might create more individual option lookups while producing little memory benefit. Correcting Site B’s abandoned cache could remove most of the avoidable footprint with one evidence-backed change.
The six signals that matter
1. Total autoloaded bytes
This is the first useful measure because it approximates how much stored option data WordPress must make available. WordPress 6.6’s Site Health check uses 800 KB as the point for raising its critical warning. The number is a diagnostic threshold, not a promise that 799 KB is fast or 801 KB is slow.
2. Largest individual contributors
A cumulative total can hide concentration. Sort by real stored byte size and determine whether a handful of rows account for most of the footprint. Large options commonly contain serialized settings, generated CSS, cached API results, logs, queues, page-builder data, or lists that were allowed to grow without a bound.
3. Request frequency
An option used on nearly every request is a legitimate autoload candidate. A similarly sized option used only during a monthly export is not. Usage should be observed across the workflows the site actually runs: public pages, authenticated admin requests, checkout, REST endpoints, AJAX, cron, and command-line operations.
4. Ownership and lifecycle
Ask which component created the value and whether that component is still active. Then ask whether the value represents configuration, a cache, a queue, a log, or business data. The answer changes the remedy:
- configuration may need to remain;
- a cache may be safely regenerated but should have a size or expiry policy;
- a queue should use a storage model built for ordered work;
- a log should be bounded and retained deliberately;
- business data should not be deleted as a performance experiment.
5. Growth rate
A stable 900 KB collection and a 500 KB collection growing by 100 KB each week are different incidents. The second will repeatedly return after cleanup unless the writer is fixed. Track the total and the largest values over time, especially after plugin updates, imports and major configuration changes.
6. Measured request behavior
Connect the database finding to a reproducible request. Compare server response time, PHP memory, database work and errors under the same URL, user state, input and cache conditions. Frontend asset weight and browser rendering are separate layers; changing an option will not compress an image or remove blocking JavaScript.
How caching changes the analysis
Persistent object caches can reduce repeated database reads by keeping WordPress objects in memory between requests. That does not turn unnecessary autoloaded data into free data. The option collection still occupies cache capacity and must be materialized for PHP when used. Very large values can increase serialization, transfer and memory costs even when the database query itself is fast.
Caching also raises an operational requirement: tools that change autoload state must invalidate the correct per-option and aggregate caches. Updating the database directly can leave PHP workers reading a stale cached collection until it expires or is flushed.
Count is still useful—just not alone
A rapidly increasing row count can reveal plugins creating dynamically named options, expired transients that are not being cleaned, multisite mistakes, or per-object data stored in the general options table. Thousands of rows can also make administration and diagnosis harder.
Use count as a discovery signal:
- Did the count jump after a release?
- Do many names share one unexpected prefix?
- Are values unique records that belong in a custom table?
- Are expired cache records accumulating?
- Is a plugin creating a new option instead of updating a bounded one?
Then measure the bytes and behavior associated with the pattern. Do not delete a family of options solely because it has many members.
A practical audit scorecard
| Question | Lower concern | Higher concern |
|---|---|---|
| How large is it? | Small relative contributor | Dominates total bytes |
| How often is it read? | Most representative requests | Rare or admin-only workflow |
| Who owns it? | Known active component | Inactive or unknown source |
| Is it stable? | Bounded and unchanged | Continuously growing |
| Can it be recovered? | Snapshot and tested restore | No rollback path |
| Is the effect measured? | Reproducible before/after test | Only a general feeling of slowness |
How to calculate the distribution, not only the total
A total tells you the weight of the autoload collection, but a distribution tells you how remediation should proceed. Export the option name, stored bytes, autoload state and suspected owner. Then group rows into useful bands—for example, under 1 KB, 1–10 KB, 10–100 KB, 100 KB–1 MB, and above 1 MB. The bands are investigation aids, not safety rules.
Calculate the cumulative share held by the largest one, five, ten and twenty options. If five rows represent 85 percent of the bytes, ownership research on those rows has high leverage. If thousands of small values create most of the total, look for a repeated naming pattern, abandoned per-item settings, or a plugin that should use a different storage model. The same total therefore leads to different engineering work.
| Distribution | Likely investigation | What not to assume |
|---|---|---|
| One value dominates | Owner, access pattern, serialization and growth | That it is safe to delete |
| Several values from one prefix | Plugin storage design and lifecycle | That the prefix proves ownership |
| Thousands of tiny rows | Per-object option misuse or abandoned installs | That row count alone causes latency |
| Many similarly sized cache entries | Expiration and regeneration behavior | That every “cache” label is disposable |
| Stable core/theme configuration | Confirm normal use and leave it alone | That aggressive minimization is beneficial |
Compare database bytes with PHP memory
LENGTH(option_value) measures stored bytes. It does not equal the memory used after WordPress loads the aggregate and PHP unserializes individual values. Arrays, object-shaped data, duplicate strings and runtime copies add overhead. Persistent object caching can keep the aggregate outside the database between requests, but PHP still receives and processes data needed for the request.
Use stored size because it is repeatable, then measure peak memory and request time to understand runtime consequence. Avoid claiming that removing 500 KB from the table will reduce every request by exactly 500 KB. The direction may be reasonable; the exact relationship must be measured on the site.
Run a cold-cache and warm-cache comparison
Test the same representative URLs in two controlled states. In the cold-cache run, clear only the relevant caches using supported controls, then record the first request and the short rebuild window. In the warm-cache run, repeat enough requests to observe steady behavior. Keep traffic, user role, URL parameters and server conditions comparable.
- Record time to first byte and total server duration.
- Record peak PHP memory and fatal/out-of-memory events.
- Observe database query time and object-cache hits or misses.
- Separate anonymous frontend, authenticated frontend, admin, REST and cron paths.
- Note whether an option’s owning feature was exercised.
If warm performance is healthy but cold-cache events cause large spikes, the autoload footprint may be one part of a cache-rebuild problem. If both states remain slow, inspect the request trace rather than blaming the options table alone.
Worked comparison: equal totals, unequal risk
Site A autoloads 1.4 MB across 2,600 rows. No row exceeds 18 KB; 1,900 rows share a prefix from a form plugin removed a year earlier. Code and vendor documentation confirm the rows are obsolete. The cleanup opportunity is a lifecycle problem involving many small values.
Site B also autoloads 1.4 MB, but 1.1 MB belongs to one active commerce configuration read on product and checkout requests. The remaining rows are ordinary. Deleting the dominant value would reset business settings. Disabling autoload might add repeated retrieval on high-traffic paths. The safer path is to profile use, ask whether the plugin can split rarely used data, and benchmark any supported change.
“1.4 MB and many options” describes both sites poorly. Site A needs verified orphan cleanup; Site B needs owner-aware architecture and measurement. A row-count target would hide that distinction.
Turn growth rate into an early-warning signal
Take the same inventory on a schedule and compare by option name and owner. Record total change, new entrants, removals and the fastest-growing values. A site that remains below a warning threshold can still have a serious defect if one option doubles every week. Conversely, a stable footprint slightly above a generic threshold may be less urgent than a smaller but unbounded queue.
When a value grows, inspect what appends to it and whether old elements expire. Common causes include logs, completed jobs, remote API responses, session-like records, dismissed notices and accumulated per-item configuration. Offloading stops broad loading cost, but only retention, pruning or a better data model stops growth.
Build a weighted decision score
A useful score should combine impact and confidence rather than declaring a value safe from size alone. Rate each candidate on byte contribution, access frequency, owner confidence, regeneration safety, growth rate, business criticality and rollback quality. Use the score to order human review, not to automate deletion.
For example, a large, admin-only, well-owned, easily restored value may be a strong candidate for testing with autoload disabled. A similarly large value with unknown ownership and checkout access should be retained while research continues. A small confirmed orphan can be cleaned eventually but will not materially resolve the warning.
SQL and reporting pitfalls that distort the comparison
Measure the correct site and table. In Multisite, each subsite has its own options table while network-wide settings live elsewhere. A report against the primary site does not describe every subsite. Confirm the table prefix and blog ID, and never combine sites into one total without labeling the scope.
Do not filter only on autoload = 'yes' when the installed WordPress version recognizes additional values. Do not use character count when you mean stored bytes, and do not sort formatted strings such as “1.2 MB” lexically. Preserve raw numbers. Exclude database indexes and table overhead when discussing option payload, but include them when planning storage.
Serialized data also creates attribution traps. One option row may contain thousands of records produced by multiple plugin modules. The row count is one, yet remediation may require pruning individual elements through the owner’s API. Editing serialized text manually can corrupt lengths and should not be used as a shortcut.
How to present the finding to a client or stakeholder
Report the baseline in plain language: total autoloaded payload, percentage held by the largest contributors, observed growth, and whether representative requests show a measurable cost. Separate confirmed facts from hypotheses. “Option X is 900 KB and read on checkout” is evidence; “Plugin X makes the whole site slow” is a conclusion that needs isolation testing.
Offer decisions with consequences. Keeping the value preserves behavior but retains broad loading cost. Disabling autoload is reversible but may add retrieval on the owning route. Redesign requires vendor or development work. Deletion is appropriate only for confirmed disposable or orphaned data. Include the backup, test plan, owner and review date for the chosen path.
Verification worksheet
- Capture the same inventory before and after the change.
- Confirm the intended option retained its exact value unless deletion was approved.
- Clear relevant caches through supported controls.
- Test cold and warm requests across the affected contexts.
- Exercise the owner’s settings, background jobs and failure paths.
- Compare p50 and p95 server timing rather than one fast request.
- Review PHP, database and application logs.
- Watch whether the owner recreates the previous autoload state.
- Retain rollback data through a complete business cycle.
Close the change only when the footprint is reduced as intended, the owning workflow still works, and observed performance is equal or better. If the result is neutral, keep only changes that simplify risk or capacity for a documented reason. Optimization without evidence should remain an experiment, not become permanent folklore.
Questions to ask a plugin vendor
When a dominant option belongs to third-party code, send the vendor a reproducible report instead of a vague performance complaint. Include the plugin and WordPress versions, option name, stored size, growth period, pages or jobs that read it, cache configuration, and a sanitized sample of its structure. Ask whether the option is expected to autoload, whether it can be regenerated, whether a supported pruning tool exists, and whether changing the autoload state is covered by support.
Also ask what retention bound the plugin enforces and whether a future release migrates the data. If the vendor recommends deletion, request the exact preconditions and consequences. Test that instruction on staging and preserve the response with the change record. A support answer improves ownership evidence, but it does not replace a backup or site-specific verification.
Define a sustainable target
Do not choose a universal row or byte target copied from another site. Set a local budget using the current baseline, traffic model, memory limits, cache behavior and business-critical routes. The budget should trigger investigation before resource pressure becomes an incident. Track both the total and the largest contributors so one growing value cannot hide inside a stable row count.
A useful target is directional and governed: no unexplained growth, no unbounded values, clear ownership for major contributors, and measured request behavior inside the site’s performance budget. That standard remains meaningful across hosting changes, while an arbitrary “number of options” does not.
Review the budget after major plugin installations, migrations, campaign launches and cache-architecture changes. Keep the measurement method identical so trends remain comparable. If the method changes, run the old and new reports together once and document the difference; otherwise a reporting change can look like sudden database growth or an improvement that never occurred.
Assign an owner to investigate budget breaches and a separate approver for destructive cleanup. That small governance step prevents an urgent performance alert from turning into an undocumented production deletion. It also makes recurring growth visible to the team responsible for the plugin or workflow that produces it.
Using Autoloaded Options Manager for this comparison
Autoloaded Options Manager displays the real MySQL byte size of each autoloaded option, sorts the largest contributors, attributes likely ownership, and shows the cumulative health state. This prevents the audit from collapsing into a raw row-count exercise.
The Safety Analyzer adds two types of evidence: it watches runtime option access during a controlled session and scans installed plugin and theme code for usage patterns. Results are classified as Safe, Caution, or Keep. Automatic snapshots, protected critical options, an activity log, correct cache invalidation and rollback support make small controlled experiments possible.
Neither signal is omniscient. Runtime analysis sees only the workflows exercised during the observation period. Static scanning can miss dynamic option names or values read outside conventional WordPress code. Unknown and high-value business settings should remain unchanged until their role is established.
A safe decision sequence
- Measure total bytes and row count.
- Rank options by stored size.
- Identify the owners of the largest contributors.
- Observe representative runtime use.
- Separate configuration from caches, queues, logs and business data.
- Take a snapshot and a database backup.
- Offload one high-confidence, rarely used value.
- Test the owner’s workflow and representative requests.
- Compare the footprint, memory and request measurements.
- Fix the writer if the value or row family keeps growing.
Related WPStack guides
A healthy report should leave the next operator able to reproduce the measurement, explain the risk, and identify the owner without guessing.
Frequently asked questions
How many autoloaded options are too many?
WordPress does not publish a universal maximum count. Measure total bytes, largest contributors, access patterns, ownership and real request behavior.
Is one large option worse than many small options?
It can be. One rarely used multi-megabyte value may add more avoidable work than hundreds of small, frequently used settings. The actual result depends on caching, serialization, request frequency and the server environment.
Should every large option have autoload disabled?
No. Size raises the value of investigation, but frequently used runtime configuration may still belong in the autoloaded collection. Change it only after reviewing how it is used.
Does reducing option count improve frontend image or JavaScript performance?
No. Autoload optimization addresses a server-side WordPress data path. Image bytes, CSS, JavaScript and third-party browser requests require separate analysis.
What if an option becomes large again after cleanup?
Find the code or workflow writing it. Add retention, expiry, batching, or an appropriate storage model. Repeated cleanup treats the symptom.
Should I aim for the smallest possible autoload footprint?
No. The objective is an intentional collection containing data genuinely useful to frequent requests. Removing necessary values can trade one broad read for many individual reads or break functionality.
References
- WordPress Core: disabling autoload for large options
- WordPress Developer Reference:
wp_load_alloptions() - WordPress support discussion: why count alone may not explain site latency

Aditya Bhimrajka is a technology entrepreneur, product strategist, and software solutions expert with over a decade of experience building scalable web and mobile applications. His expertise spans SaaS, AI, cloud technologies, custom software development, and digital transformation. Passionate about solving real-world business challenges through technology, Aditya shares practical insights on WordPress, plugins, software development, startup growth, product strategy, and emerging technologies. At WPStack, he writes actionable, experience-driven content that helps developers, businesses, and website owners build secure, high-performing, and future-ready WordPress solutions.